Summary
- With the Help Desk’s assistance, Spotlight PA, a nonpartisan investigative journalism publication, created a tool that enables Pennsylvania residents to easily look up information about their old and new districts.
- They created accounts and downloaded some of the necessary data from RDH.
- But differences in the population data and geographies released by the Census Bureau relative to what the state of Pennsylvania used for redistricting complicated the process beyond what the expertise of the team at Spotlight PA could do on their own.
- We were aware of the difficulties they would encounter when working with these data, and so we volunteered our assistance.
- In consultation with their team, we merged and aggregated population and partisan data to the old and new districts, and sent them custom datasets that they could use to create their tool.
- See how districts have changed as a result of redistricting with Spotlight PA’s Pennsylvania Redistricting Lookup Tool.
- Access the code on our Github to see how we approached this problem or create a similar dataset for your state.
Creating a tool to compare old and new legislative districts
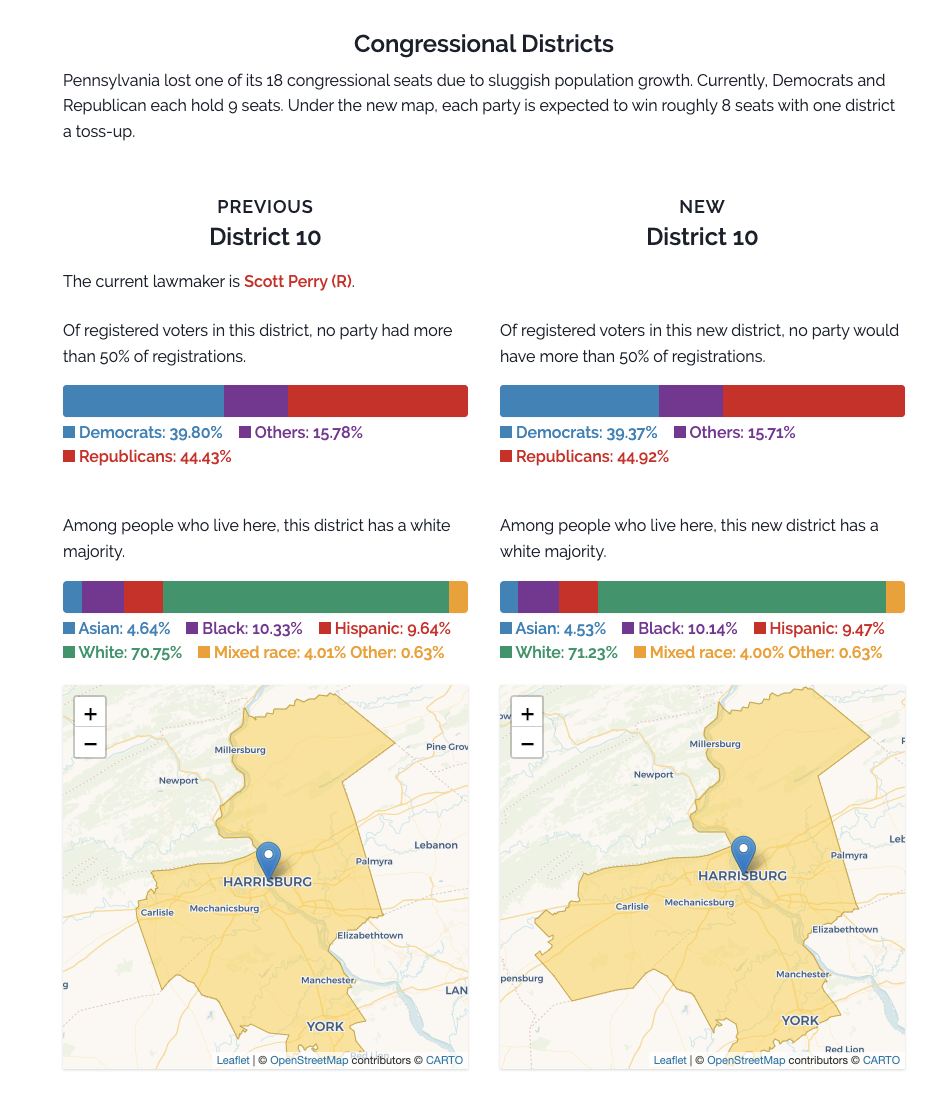
Spotlight PA, a nonpartisan news organization, reached out to us through our Help Desk to create a tool that compares Pennsylvania’s old and new state legislative and congressional districts.
This tool allows users to enter an address and see the old and new district boundaries for the Pennsylvania State House, State Senate, and US Congressional maps. In addition to the maps, they provided users with a breakdown of partisan and demographic information about the old and new districts.
Pennsylvania Redistricting Lookup Tool
Spotlight PA is dedicated to producing nonpartisan investigative journalism about Pennsylvania government and urgent statewide issues. They connect Pennsylvanians to their state, and to each other, through public service journalism that matters to their lives and is creatively told in the many modern, digital ways they consume their news.
Merging additional data with a geospatial redistricting plan
Preparing to analyze redistricting plans
When a redistricting plan is enacted, the state or local government typically releases the boundaries of the new districts as geospatial data (shapefiles or a block assignment file). While it is important to know the boundaries of the new districts, it is also useful to understand other characteristics about the districts, such as their demographic makeup or partisanship. However, additional data must be merged with this geospatial data in order to answer questions about the characteristics of districts themselves.
Geographies and data aggregation
Redistricting often involves data released at the census block level, the smallest unit of geography used by the US Census Bureau. Other demographic and partisan data is typically collected and reported at levels of geography smaller than a legislative or congressional district, such as block groups, precincts or voting tabulation districts (VTDs), or counties.
In order to merge demographic, electoral, or other data with a redistricting plan, then, data aggregation will almost always be required. Data aggregation is the process of summing data from smaller levels of geography to larger ones. By summing data from all census blocks within districts, for example, one can compare districts based on the characteristics of the population.
Allocating the data when aggregating
To create the tool, Spotlight PA needed to aggregate both census data (containing racial and ethnic information) and voter file data (containing party registration information) from the census block level up to the old and new districts. Fortunately, states typically create districts out of census blocks, so that the blocks are perfectly nested within districts and aggregation is straightforward. If districts are not drawn from census blocks, however, there could be instances in which census blocks are split across multiple districts. In turn, this would mean deciding how to allocate the data when aggregating. For example, imagine a census block that contains 100 individuals and is split across district boundaries. In order to analyze the districts, these 100 individuals will need to be allocated specifically to one or the other district. This allocation is necessary because we don’t have data on individuals, or where they reside within the census block. The possibilities for allocation range from allocating all 100 to one district, to allocating all 100 individuals to the other district, and all the combinations in between (allocating 1 individual to one district and 99 to the other, and so on).
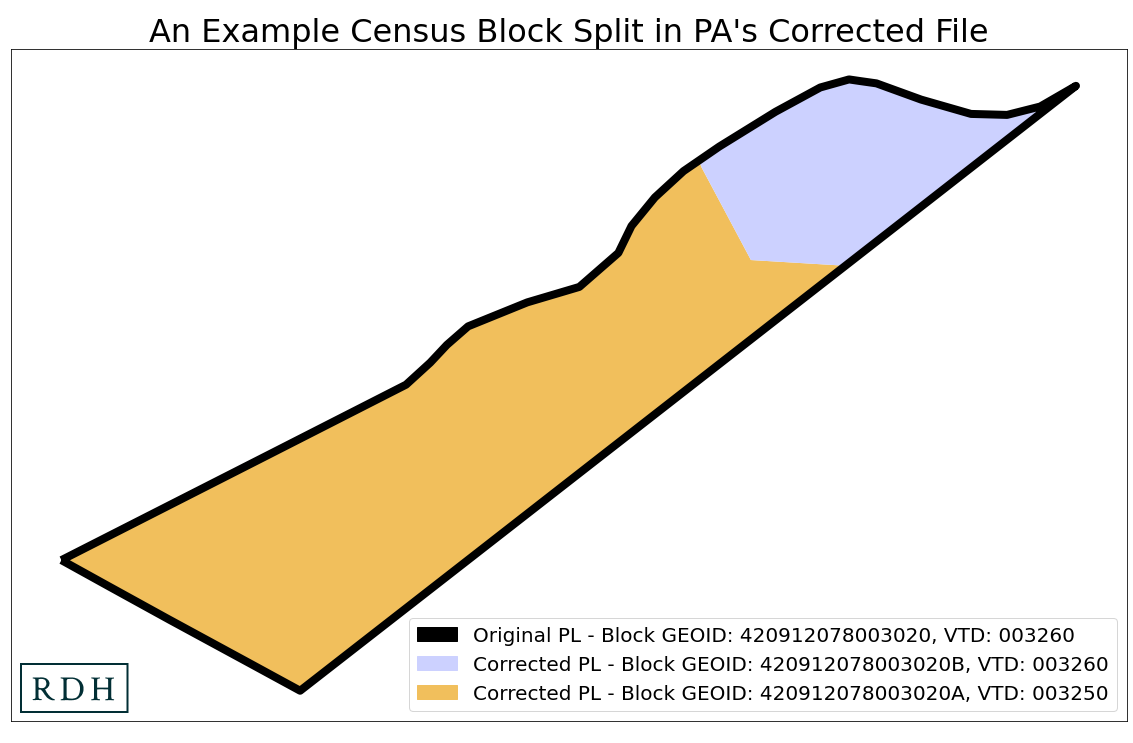
The split block problem
Pennsylvania is only one of two states in which split blocks are a potential problem for aggregating data to districts. The state released official population data files that “correct issues in the original 2020 data received from the Census Bureau, such as… split block issues.” While they did not provide additional detail explaining why they split some census blocks, it appears as though they were to prevent splitting intermediate geographies, such as municipalities or VTDs. For this analysis, every split census block was wholly contained within a single House, Senate, and congressional district, which meant that aggregation of the population data up to the districts by itself would not be a problem. However, Spotlight PA wanted to consider party registration data, as well, and this data was available for “uncorrected” census blocks. This meant that we had to merge the “corrected” split blocks from the population data with the “uncorrected” whole blocks from the voter file data, before aggregating to districts. In other words, we “unsplit” these blocks back into their original form, so that we could merge and aggregate the data.
Census data adjustments
Pennsylvania was also one of 12 states that made adjustments to the census data in order to reallocate incarcerated individuals back to their last known address. This was done to combat the distorting representational effects of prison gerrymandering. The adjusted data was used only for state legislative redistricting; congressional redistricting was performed using the original, unadjusted census data. The state released official datasets – one adjusted and one unadjusted – and both containing the corrected (split) census blocks.
Datasets necessary to analyze or summarize district characteristics
These datasets were necessary in order to provide both census and voter file data for state legislative and congressional districts:
PL 94-171 data
The PL 94-171 data at the “uncorrected” 2020 census block level in csv format. This contains data on the total population, as well as the population by race and ethnicity (used for congressional redistricting).
This dataset also contains block assignments to the “old” districts in effect in 2020. This dataset is available through the Redistricting Data Hub by creating a free account and filtering by type of data: PL-94-171.
Official adjusted data
Shapefiles of the official adjusted PL 94-171 dataset at the 2020 census block level. This contains data on the total adjusted population, as well as the adjusted population by race and ethnicity (used for legislative redistricting).
This dataset is available by creating a free account and typing “official” in the Filter by Name field on the state page. This file is necessary for states that adjust the census data.
Voter file
2021 L2 voter file data aggregated to the 2020 census block level in csv format. This contains data on voter registration totals by party.
This dataset is available through the state pages and filtering by source: L2.
Current maps 2022
Block assignment files for the new House, Senate, and US Congressional districts. Navigate to the current maps for the state on DRA, and open up each of the three official maps. On each map, click the arrow pointing to the upper-right, check “Export alternate census blocks,” and export the block assignment files.
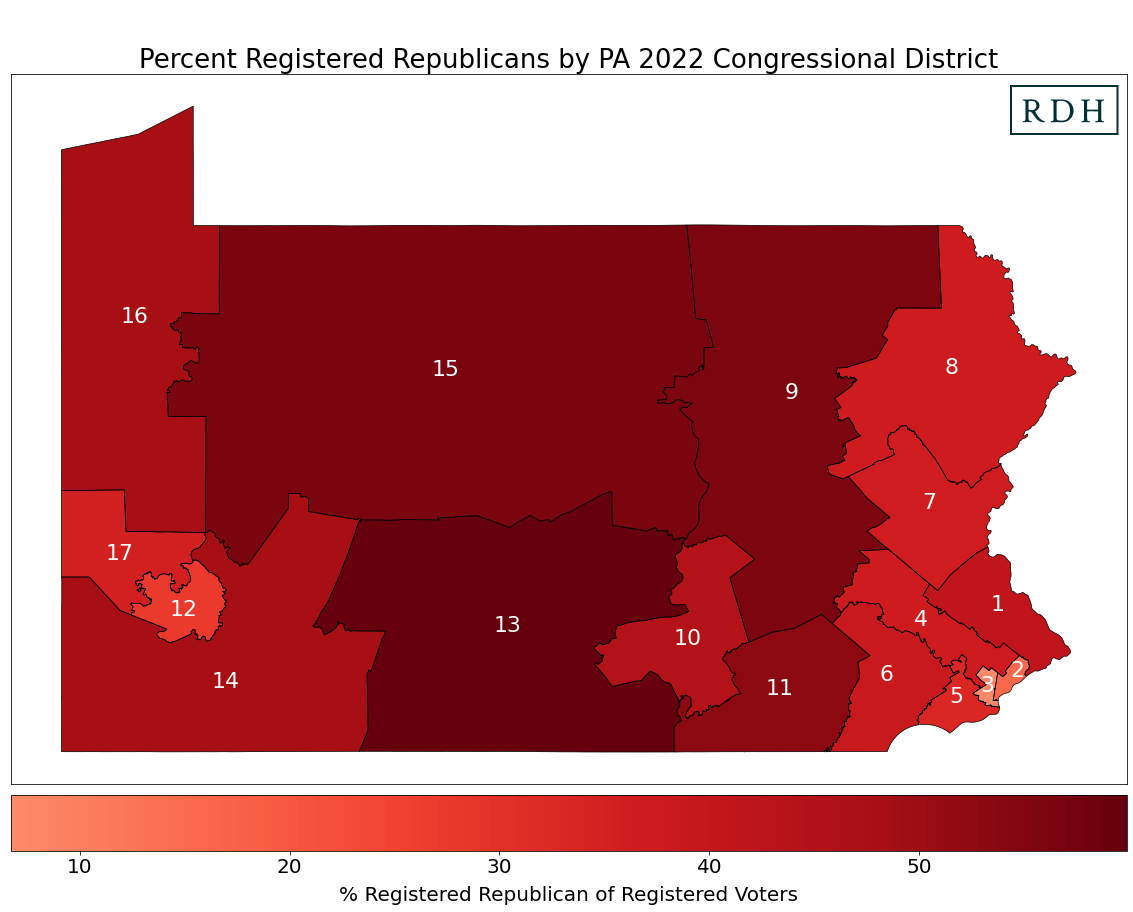
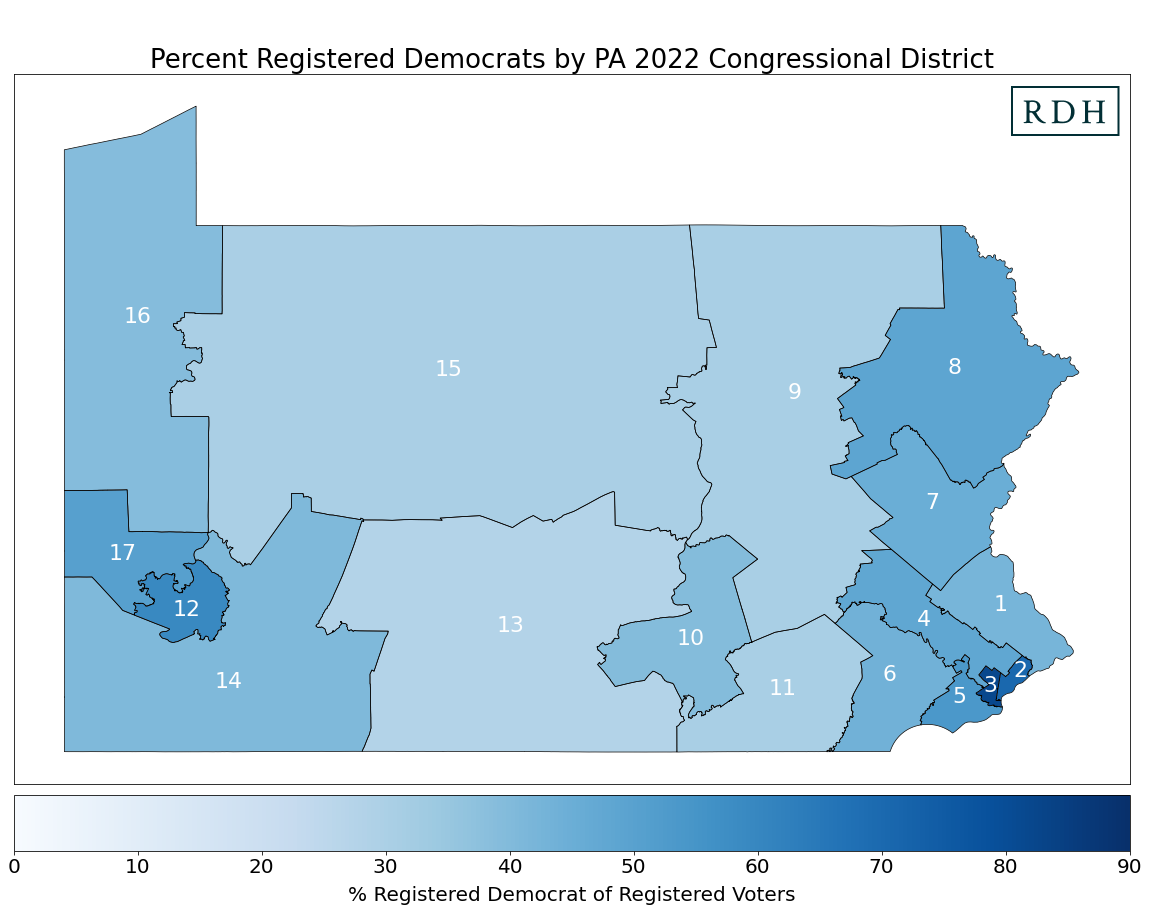
Partisan representation in Pennsylvania’s 2022 districts
These maps show the percent of registered Democrats and Republicans based on voter file data at the block level that has been aggregated up to the new 2022 congressional districts. The darker the shade of blue or red, the greater the share of Democrats and Republicans, respectively, within the district.
Aggregating data up to old and new districts in every state
An understanding of data aggregation can be applied to analysis of any other state’s redistricting plan. This can be done by using our code on Github, and reaching out to the help desk with any questions or requests for assistance you may have.