States (generally) make their own rules about election administration,
reporting, and redistricting
An important aspect of working with redistricting data is understanding
the rules in place in a state when it comes to election administration,
reporting, and redistricting. That is because, as a general rule, states
are constitutionally charged with administering elections, and each
state has developed their own unique rules over time. This means that
each state runs elections, reports election results, and redistricts
legislative boundaries differently.
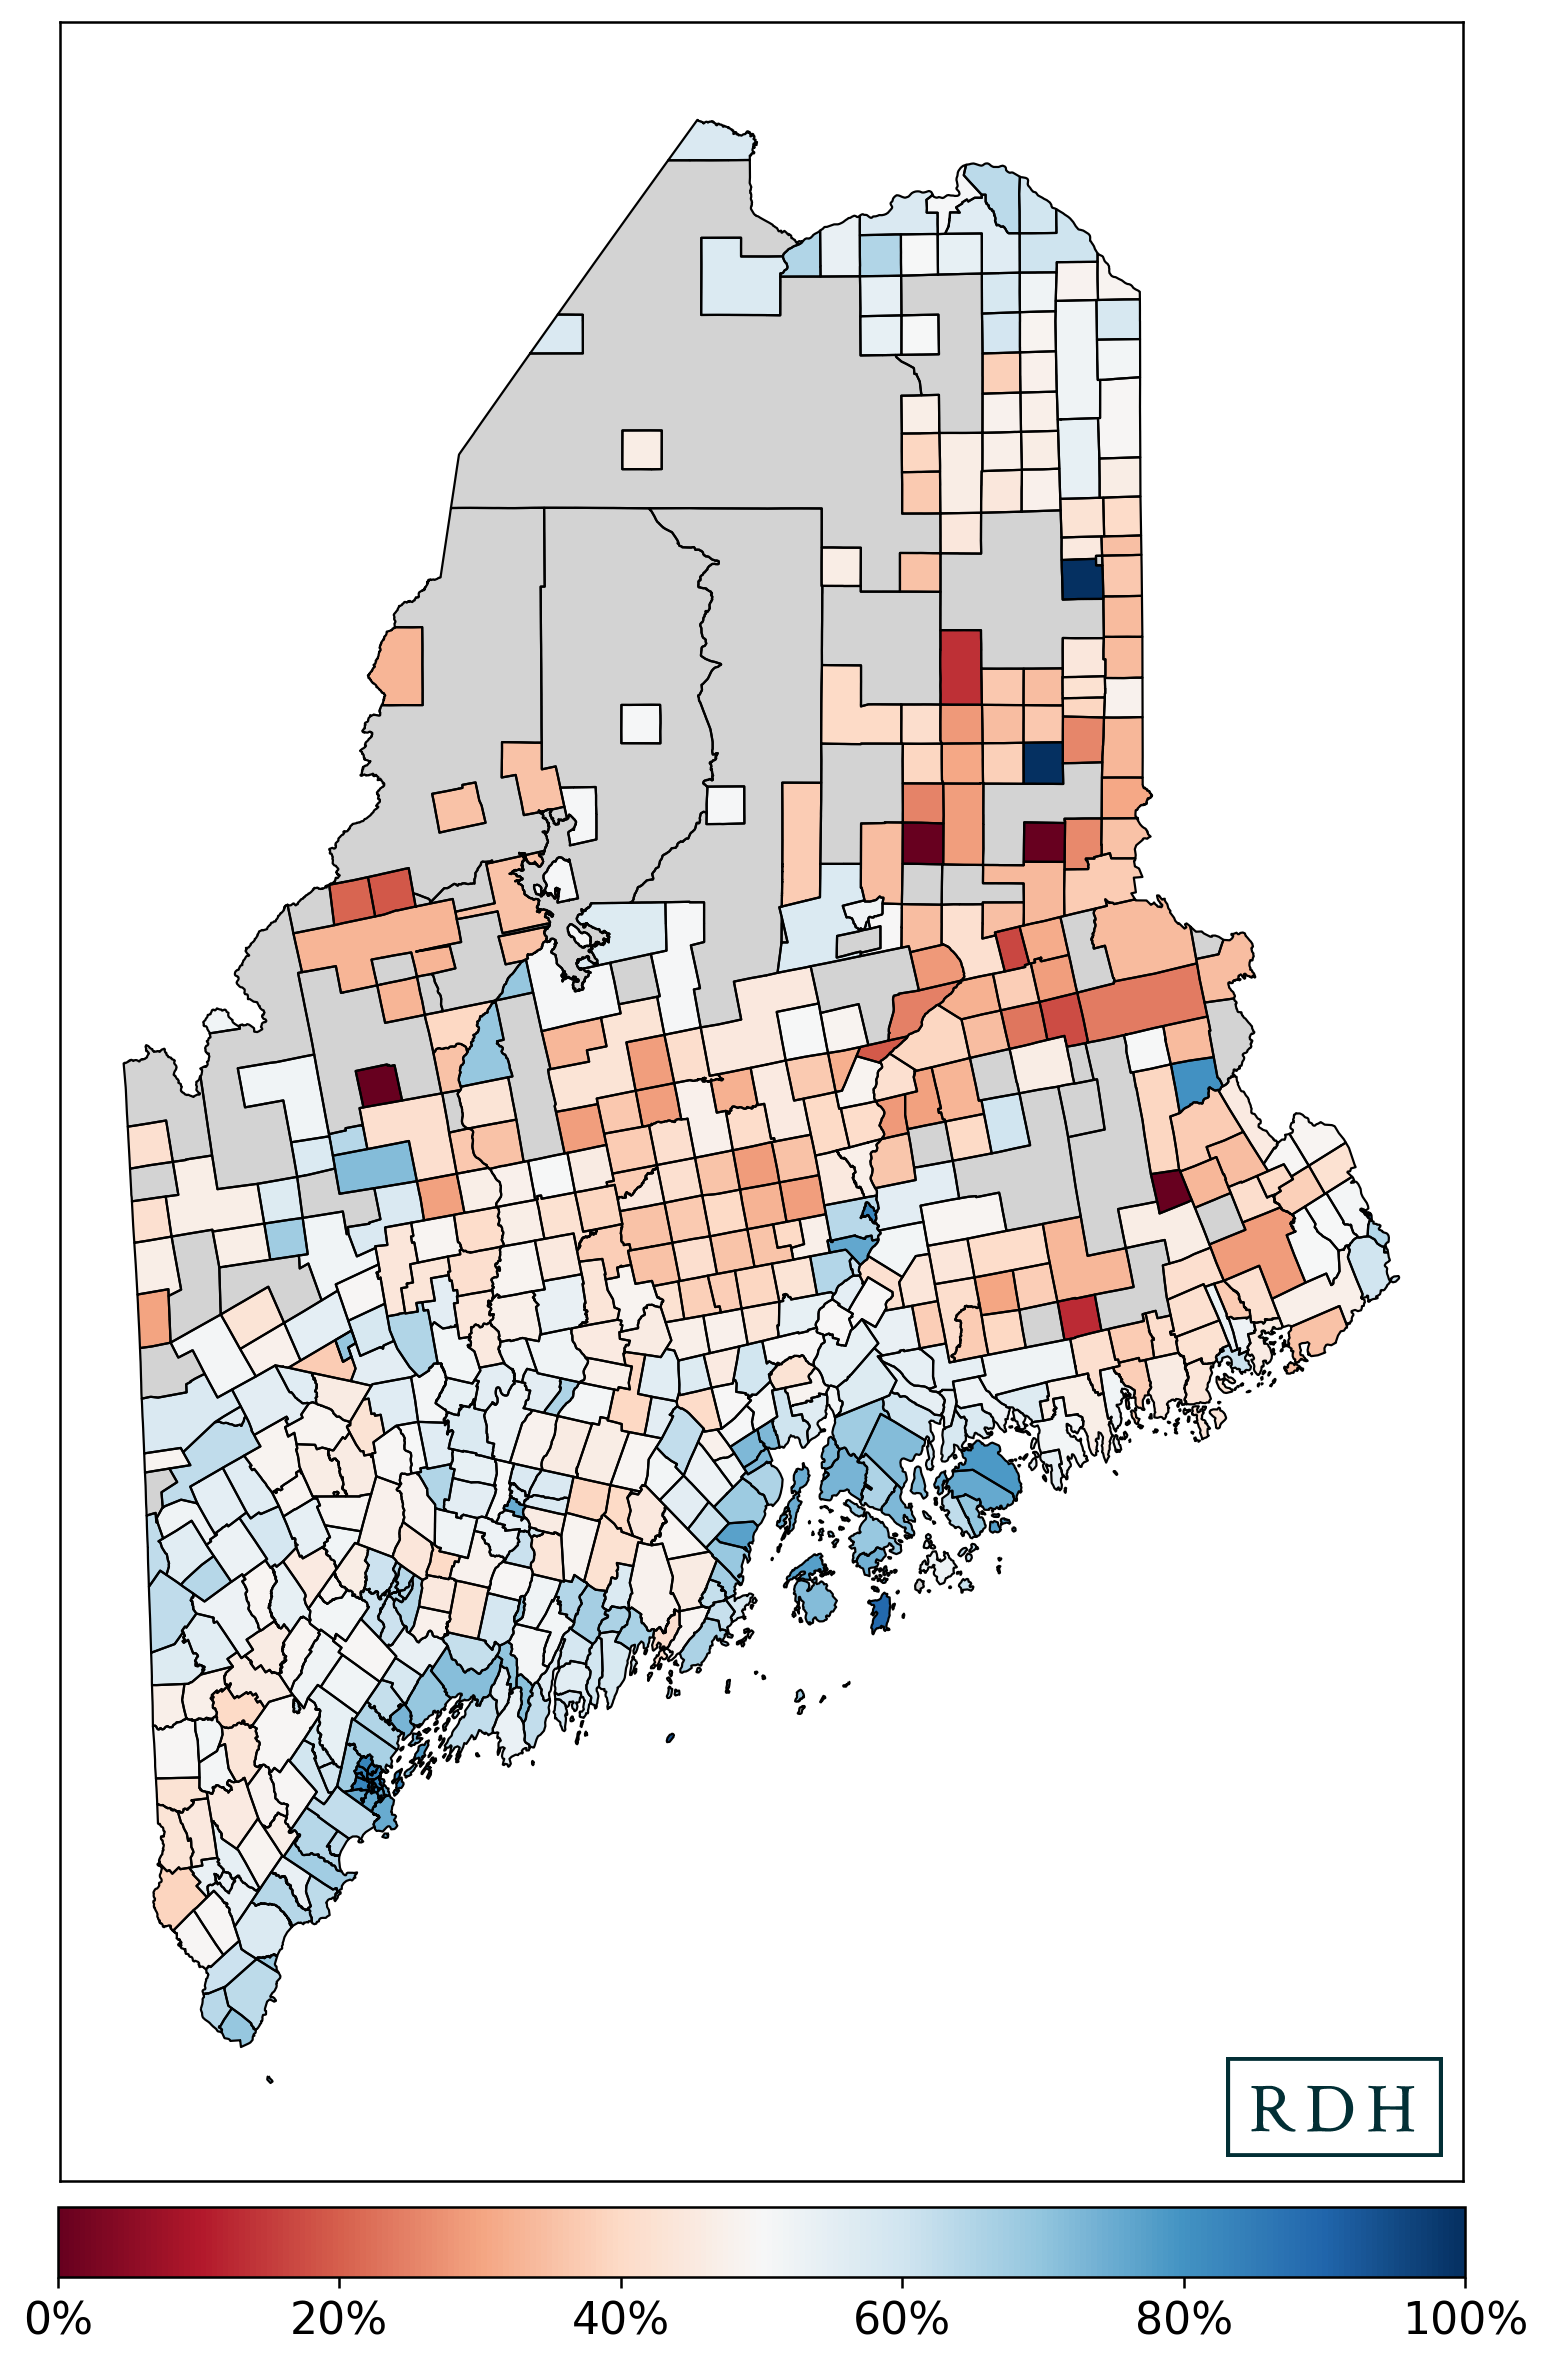
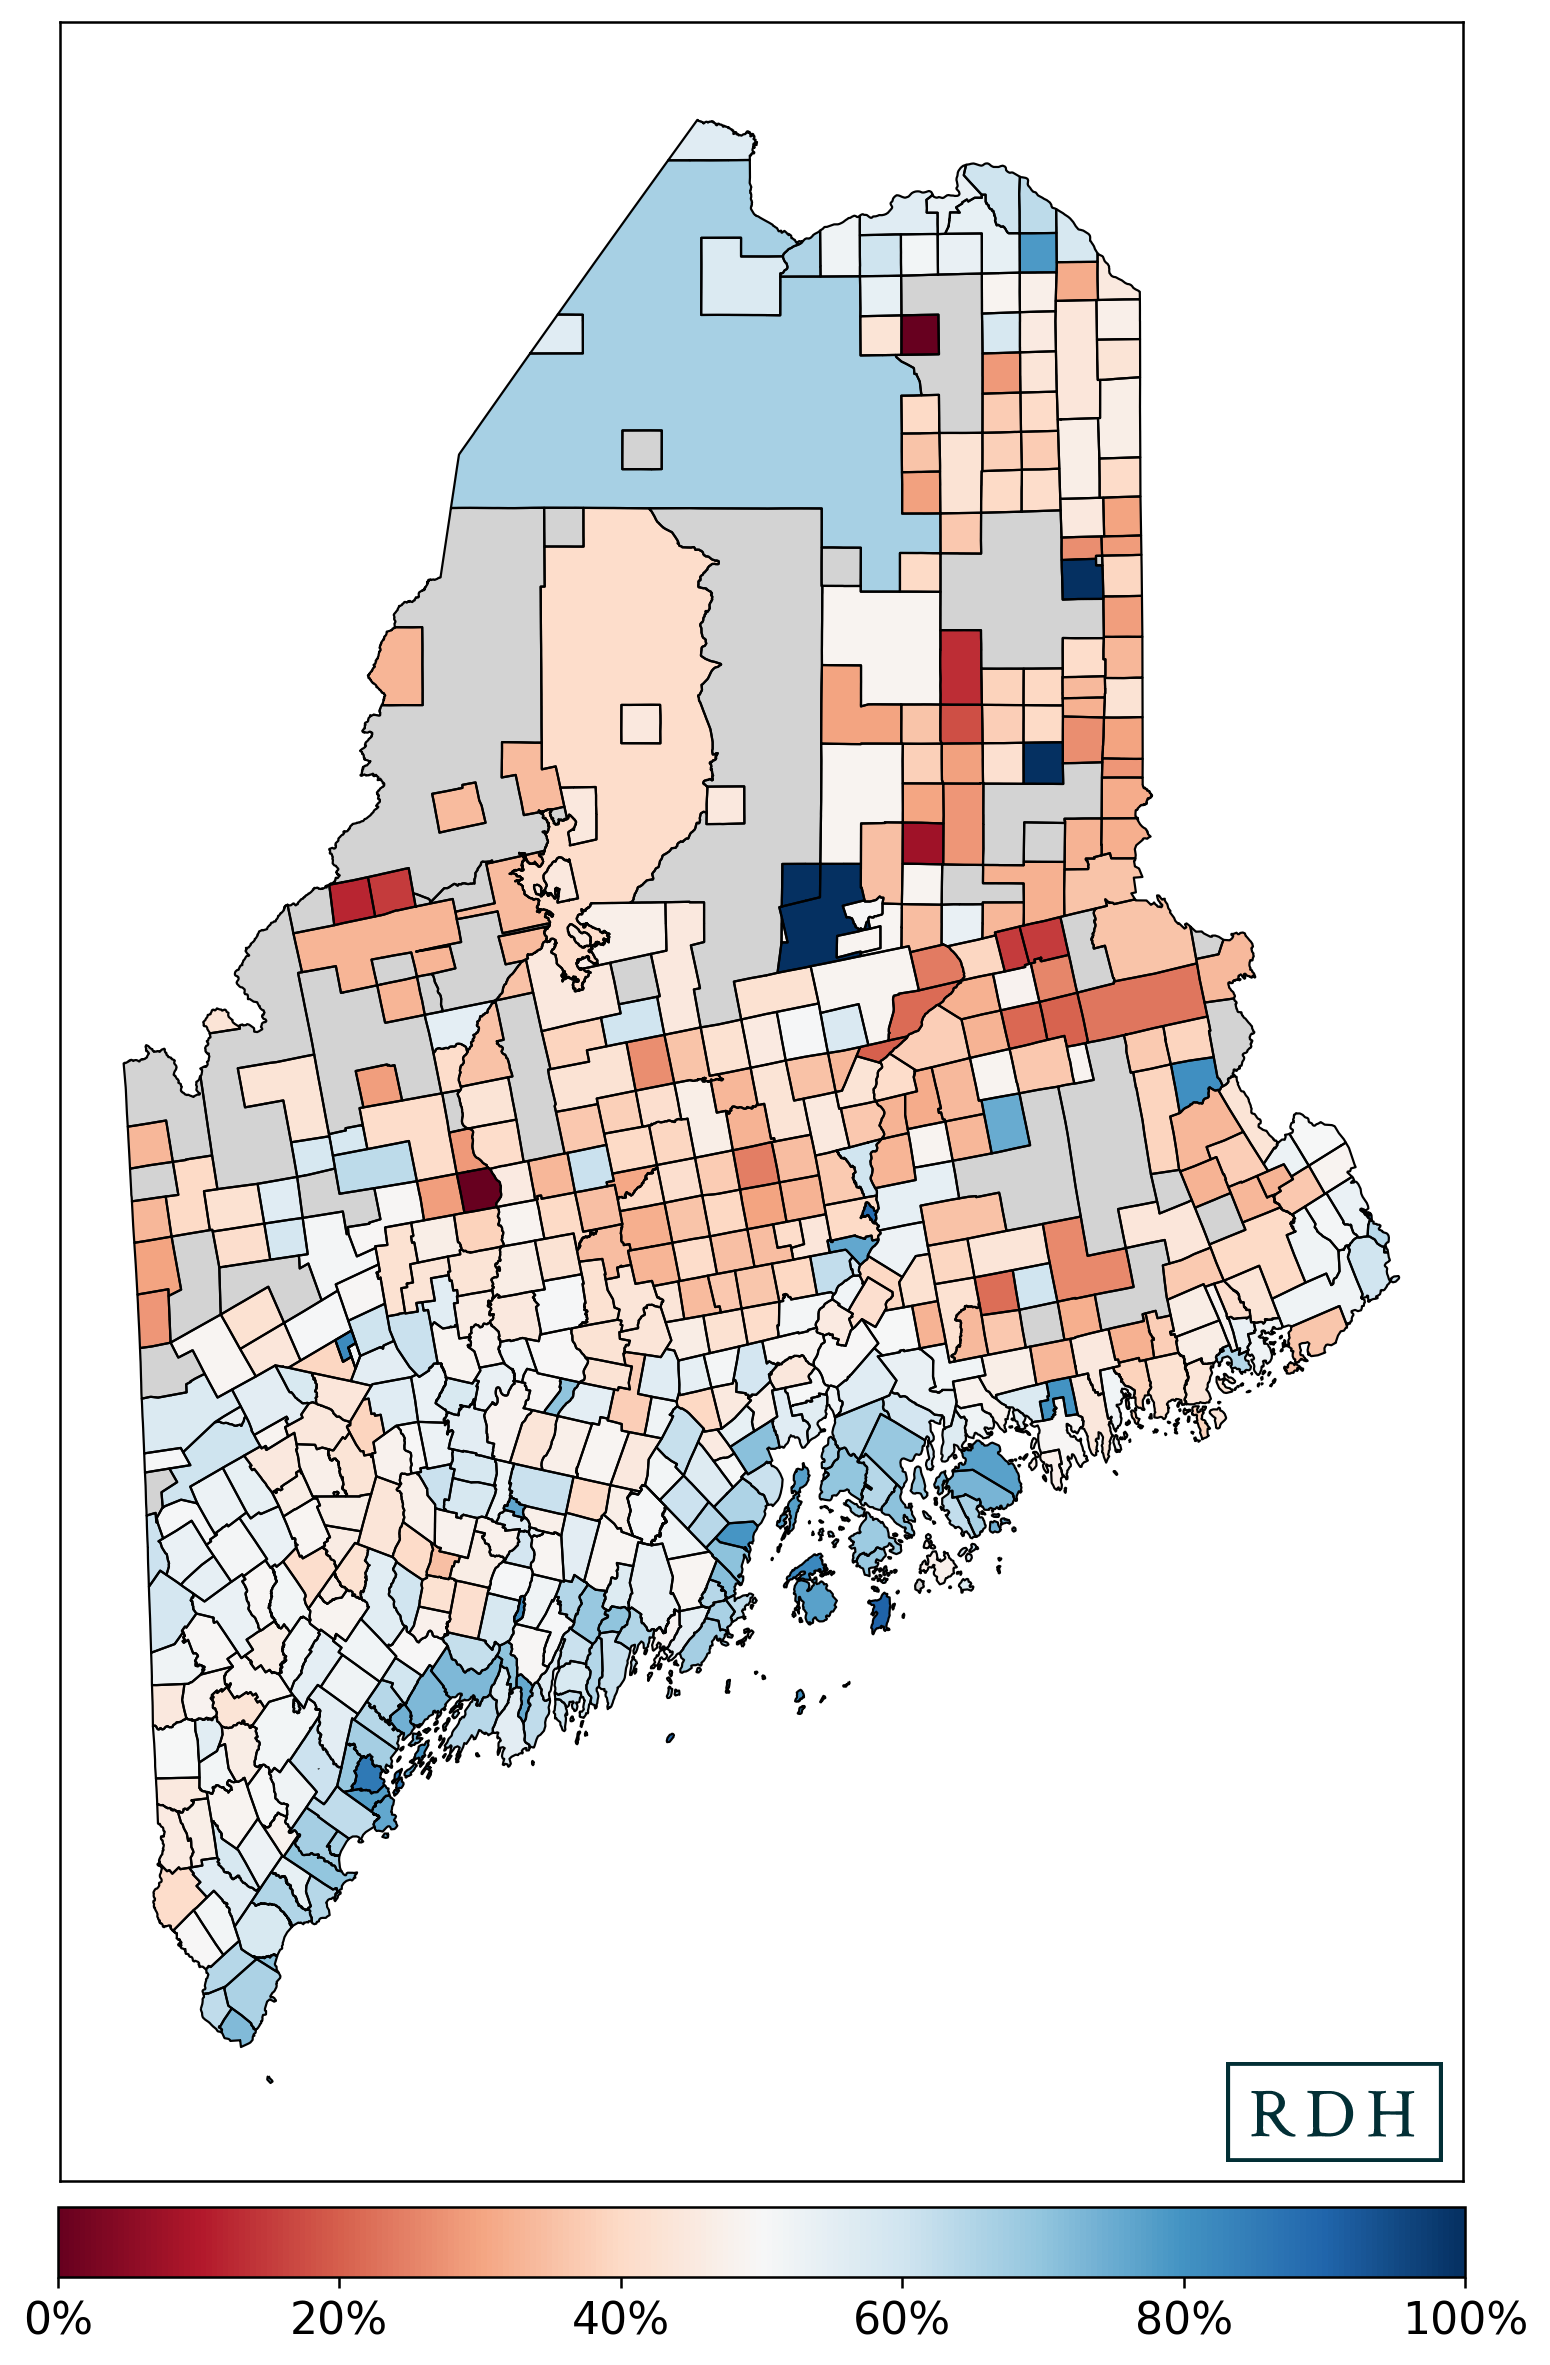
For example, Maine adopted
Ranked Choice Voting
(RCV) in 2016. In order to work with the 2018 and 2020 congressional
elections, the results had to be filtered in order to produce a file
with one number of votes cast for each candidate. In this instance, the
results of the last round of RCV in each district were used for
analysis.
Maine also has their own standards around reporting election results.
Unlike most states, in which the county or county-equivalent perform
most of the day to day administration of running elections and reporting
results, towns (also known as municipalities) administer elections in
Maine. Some towns create and report the data by wards (which is another
name for precincts). In other towns, the election results are reported
in aggregate at the town-level. When creating the precinct boundary and
election results files, our data partners report the results at whatever
level it is provided at, whether that be towns or wards.
As it so happens, the Reapportionment Commission stated they were
unwilling to split towns in the congressional plan. This meant that
town-level election results would suffice for the purposes of analyzing
proposed congressional plans in Maine. But additional processing was
necessary in order to merge the tabular election results with the
precinct boundary shapefiles.
Matching precincts by name
Maine Voices Network had acquired town-level election results from the state. Election results at the ward level are available directly from the towns who use them, but the reporting of the results are not standardized across towns. In addition, towns with wards report their absentee ballots at the town-level. The data partner who provides Maine’s election results joined with precinct boundaries allocate absentee votes down to wards based on the proportion of each candidate’s vote in the precinct. Using town-level data from the state, especially since the Commission was unwilling to split towns, would require significantly less time and effort than collecting and processing the data by contacting each town.
In order to prepare the data for joining, Maine Voices Network utilized the
precinct boundaries and election results files we had on the website to
match the precinct names in our 2020 file with the towns in their 2018
and 2020 files. This enabled us to join the election results by name.
Because some precincts have the same names, we joined the data by
matching both precinct and county.
While joining, we also noted that some precincts did not have any
recorded votes associated with them. This can happen if a state has
uninhabited areas, in which they do not create precincts. When creating
precinct boundary and election results files, our data partners create
state-wide data, which means that “null” precincts are created in order
to cover these geographic areas. It can also occur in a sparsely
populated area of a state, if no one from that area happens to vote in
that election or particular race.
Datasets necessary to analyze a congressional plan
These datasets were necessary in order to join 2018 and 2020 US
congressional election results in tabular form at the town level with
shapefiles of 2020 precinct boundaries:
Precinct Boundaries and Election Results
Shapefiles of the precinct boundaries and election results for the 2020
elections in Maine.
This dataset is available through the
Redistricting Data Hub by creating a free
account filtering by type of data:
precinct boundaries and election results.
Congressional Election Results by Town
These data were provided by Maine Voices Network at the town level for the 2018
and 2020 US congressional races in xlsx format.
Analyzing maps for partisan fairness and partisan gerrymandering
Joining multiple election results is a common task in redistricting. But
the reporting of election results comes with many idiosyncrasies, and it
is important to understand the rules in your state.
These datasets can also be used to examine the partisan fairness of a
proposed plan, or identify partisan gerrymandering.
The code we used is available on
Github. It is free to use, and if you need assistance or have any questions
about using or understanding the code, please reach out to the
Help Desk.