Prison gerrymandering is the practice of distorting representation by counting incarcerated people in the jail or prison where they are confined, rather than at their place of residence. Since the vast majority of incarcerated people cannot choose which facility to be confined at and are denied the right to vote, where they are counted impacts the representation of the communities to which they belong and in which they are confined.
In 2020, the US Census Bureau counted inmates who were in jail or prison on April 1 as residing at the facility in which they are currently incarcerated. Thee number of people in jails and prison around this time is estimated to be nearly 2 million, putting the US at the top of industrialized nations when it comes to incarceration.
At the same time, the vast majority of states prohibit incarcerated people from voting. Because incarcerated individuals typically cannot vote, districts that contain prisons have more “voting power” per capita than they should, and districts containing the homes of incarcerated individuals will have less voting power per capita.
Prison gerrymandering affects voting and representation in the US House of Representatives, state legislative districts, and local legislative bodies such as city councils, county commissions, or school boards within jurisdictions or states. By design, there are inequalities in the tallying of individuals’ votes across states, which impacts representation in the US Senate and the Electoral College. The principle of one person, one vote only applies to representative bodies.
Population equality in congressional districts is required by the principle of “one person, one vote,” as established by the US Supreme Court in the 1960s. “One person, one vote” implies that each individual’s vote within a state or jurisdiction should count equally when tallying election results, in electing representatives and in these representatives’ votes in the legislature.
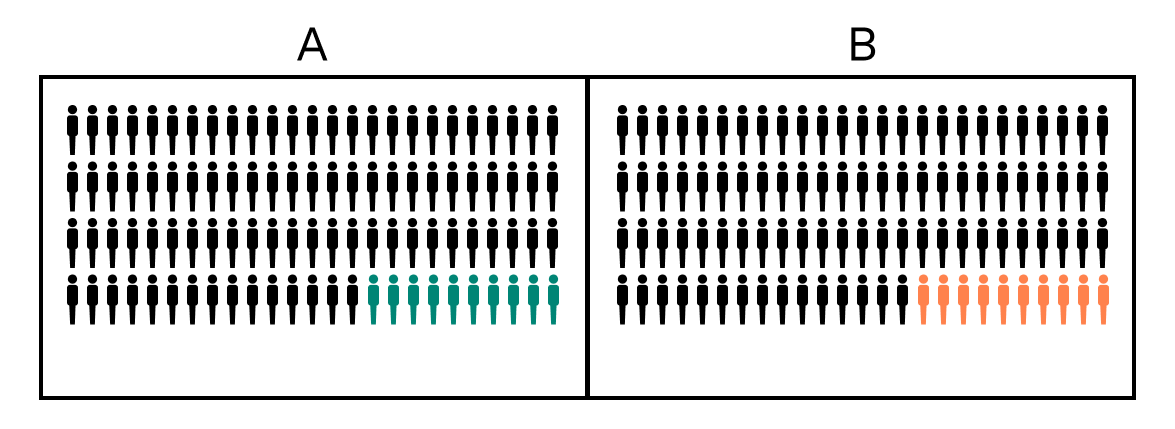
For example, imagine a state with two congressional districts and 200 individuals, 100 residing in District A and 100 residing in District B. For simplicity’s sake, in our imaginary state, everyone votes in elections.
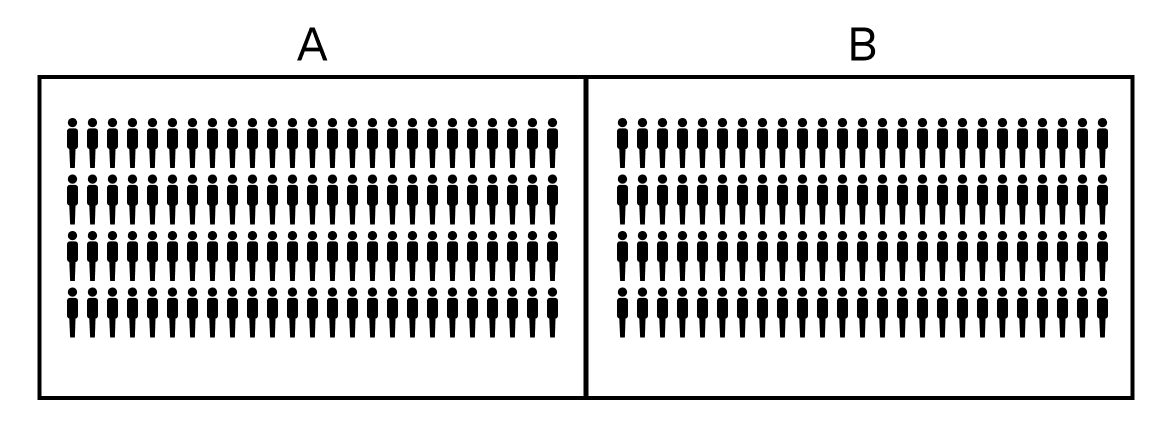
Imagine that 10 of the individuals in District A were convicted and sentenced to a prison located in District B. In this state, like many actual states, these 10 individuals are not allowed to vote while incarcerated – or on probation or parole, as in a majority of real states.
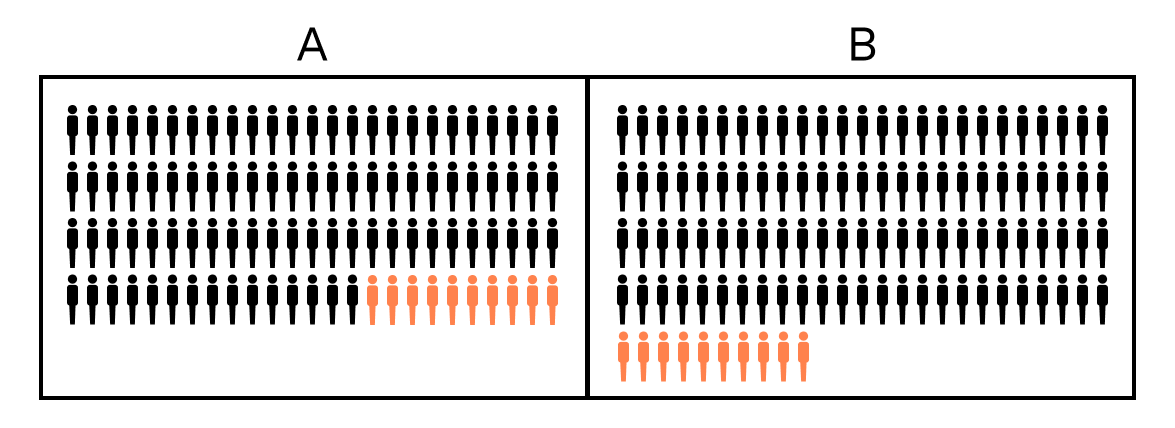
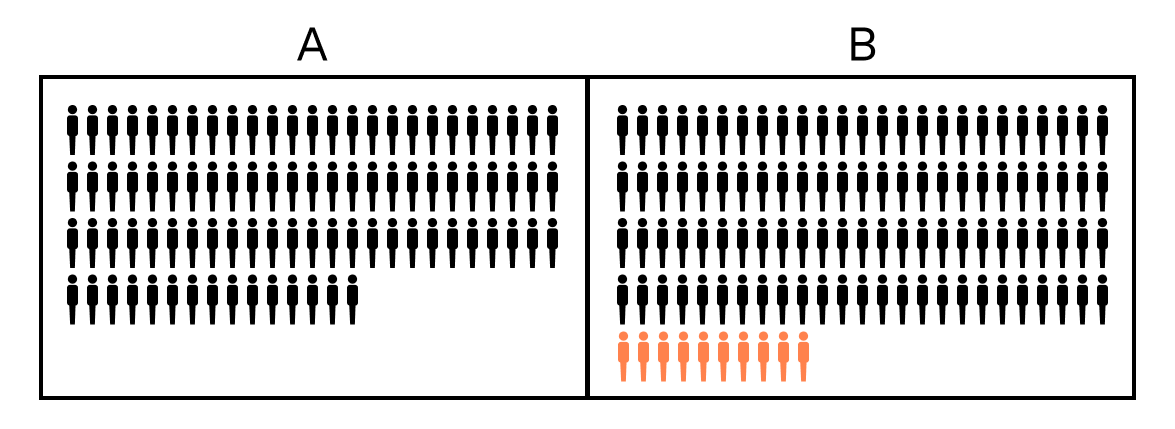
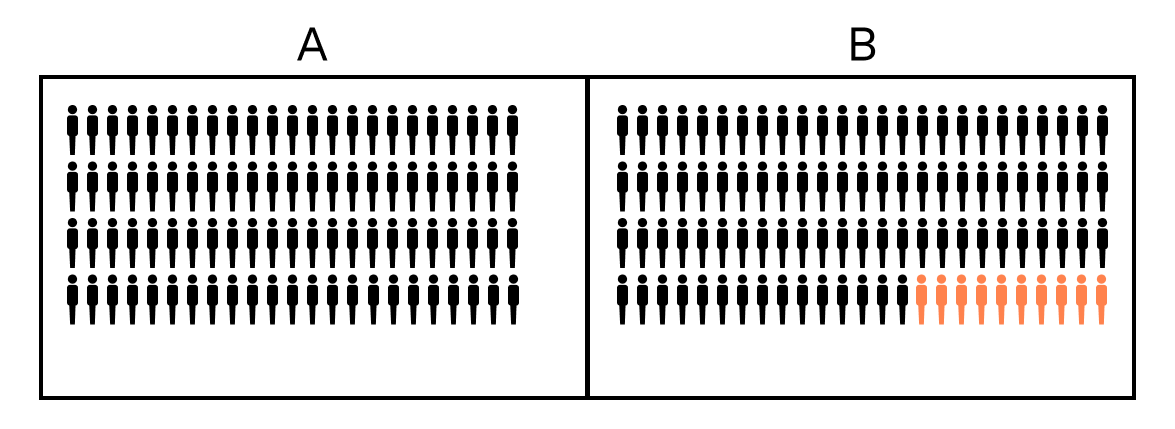
In addition, for the 2020 Census, these individuals are counted as residing in District B. If the state did not take any steps to abolish prison gerrymandering, District A would have to add 10 individuals to again achieve population equality with District B during redistricting.
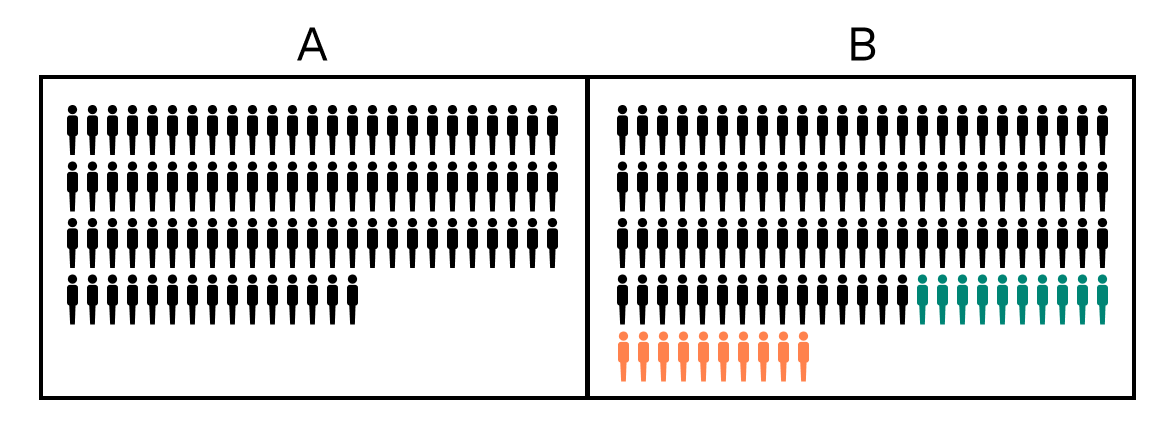
The impact of this is that District B now contains 100 individuals, 10 of which were relocated by the state from District A, and cannot vote in elections, including congressional elections. With population equality and equality of access to voting, the relative impact of each person’s vote in the next round of elections in District A and B is equal. But because District B contains only 90 individuals who can participate in elections, compared to the 100 who can participate in District A, the votes of individuals in District B are no longer equal to the votes of individuals in District A.
Specifically, the vote of each (unincarcerated) individual’s vote in District B counts more towarding electing a single representative than the vote of each individual in District A. In turn, the Representative of District B, who gets a vote equal to the Representative of District A in Congress, also represents fewer individuals, giving the unincarcerated residents of District B relatively more influence in Congress than the residents of District A.
But this is not the only distortion prison gerrymandering causes. Incarceration rates are unequal across racial and ethnic groups. As a result, prison gerrymandering not only affects the voting power of everyone in districts without facilities, it also disproportionately dilutes the voting power of communities of color.
As a result, several states (and some local jurisdictions) have prohibited prison-based gerrymandering by “reallocating” incarcerated people to their last known address. States differ widely in their methods for reallocating, including which individuals are reallocated, whether or how individuals without a last known address are reallocated, and whether reallocation is performed for legislative and/or congressional redistricting.
If you are interested in learning more about prison gerrymandering, the Prison Policy Initiative has excellent resources and explainers on the issue.
Reports on Prison Gerrymandering Reform
See our national report on the 13 states with reforms in the 2021 redistricting cycle. Download reports that estimate the impact of prison gerrymandering reform in 21 states without reforms, or request a report for your state
States that Adjust the Census Data for Redistricting
Track which states are using the PL 94-171 census data with or without adjustment for the purposes of legislative or congressional redistricting
Correctional Facility Shapefiles by State
Download 2020 State PPI Correctional facility population counts at the block level produced by Prison Policy Initiative
Counterfactual Prisoner Adjusted Redistricting Data
Download 2020 Counterfactual Prisoner Adjusted Redistricting Data in 32 States produced by Dr. Rory Kramer and Dr. Brianna Remster of Villanova University
Training Recordings
A two part training series hosted by Brianna Remster and Rory Kramer of Villanova University