Interactive Precinct-Level Election Results Maps
Election results are often summarized at the state or county level, but the real story of how people voted is told at a much smaller scale. Our interactive election results maps display data at the precinct level, the smallest geographic unit for which votes are typically reported.
Looking at results this way can reveal patterns that larger totals obscure, such as differences between neighboring communities, urban and rural divides, or pockets of support that run counter to a county or state trend. Whether you are a voter curious about your own neighborhood, a student interested in electoral geography, or a community organization looking for local detail, these maps offer a closer look at how votes were cast.
Maps are currently available for five select states. Continue reading for tips on using the maps, or dive right in!
About the Maps
Reading the Maps
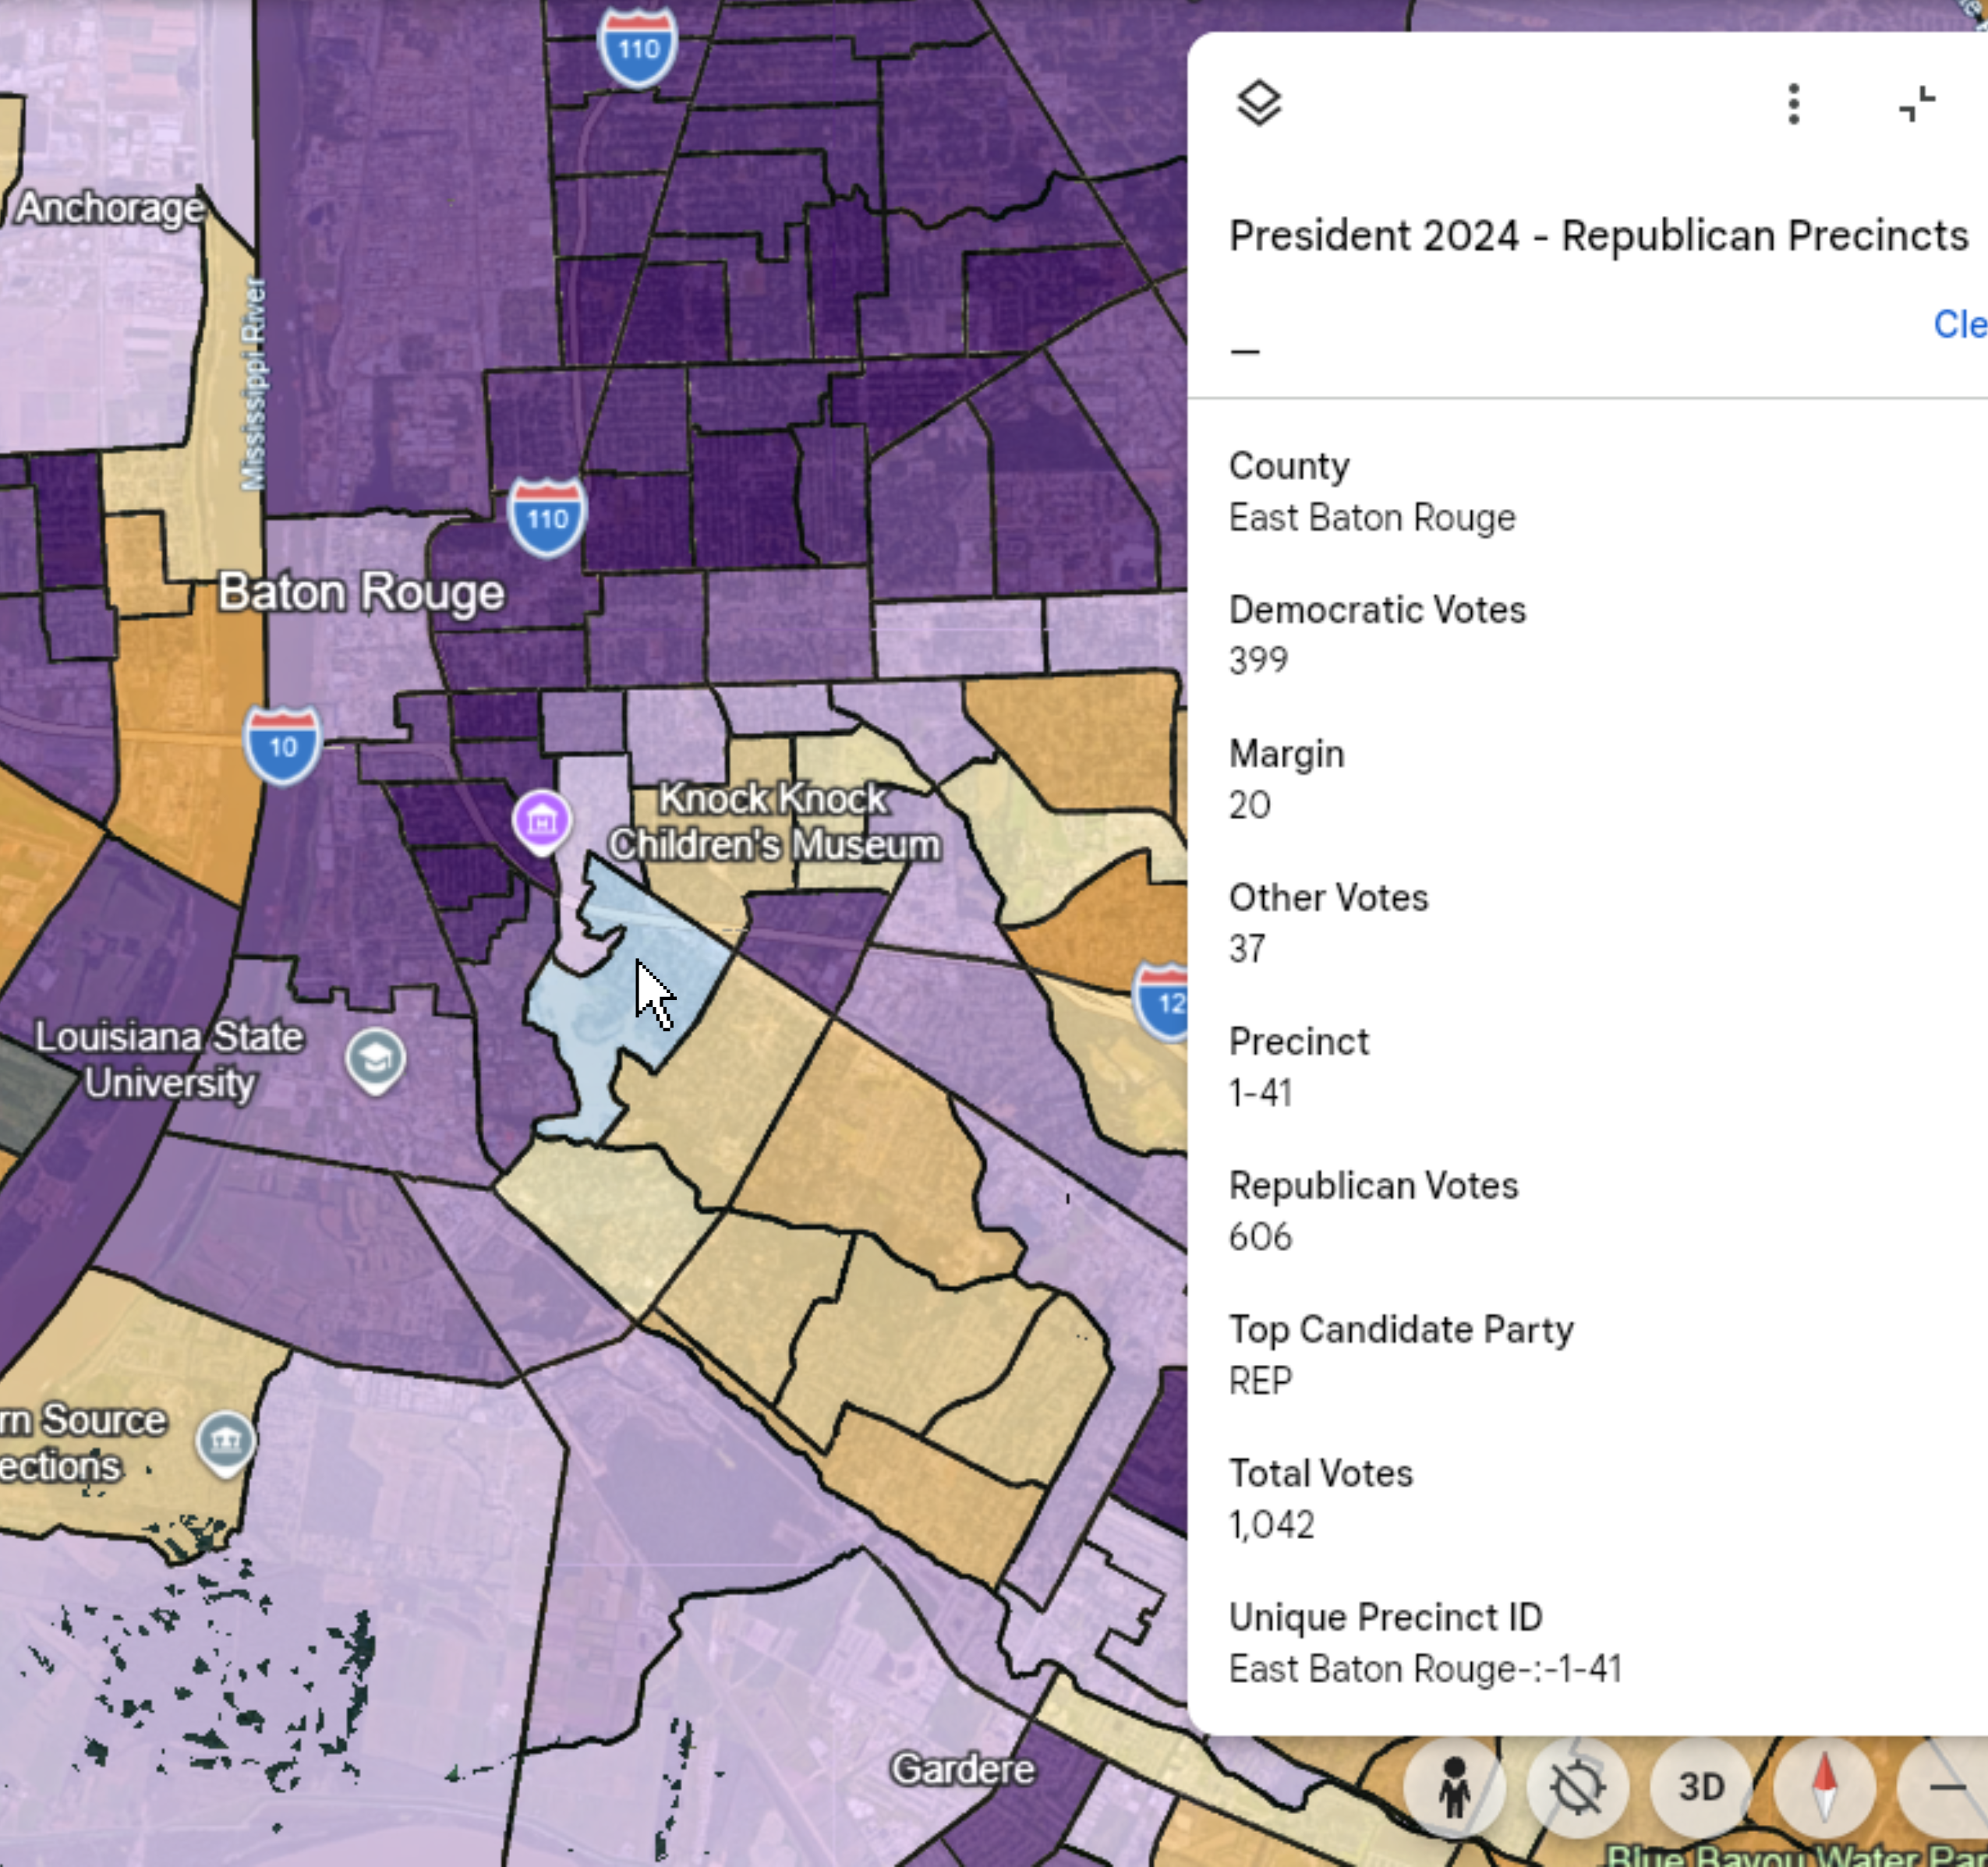
Precincts are shaded to indicate which party’s candidate won. Color intensity shows margin of victory: pale where the race was close, and deep where it was lopsided. A precinct shaded grey means no result, rather than missing data. Between one and about thirty precincts per state had no votes cast or an exact tie.
Click any precinct for its actual vote counts. Your selected precinct will be highlighted in light blue, and a panel will pop up to display the data.
Please note that color intensity is NOT comparable between the two parties. This is a limitation of Google Earth, which does not offer a two color gradient scale. Each party is scaled separately, so a dark purple precinct and a dark orange precinct may not represent the same margin. Compare shades within a color, and click through to see the data.
Using the Map Layers
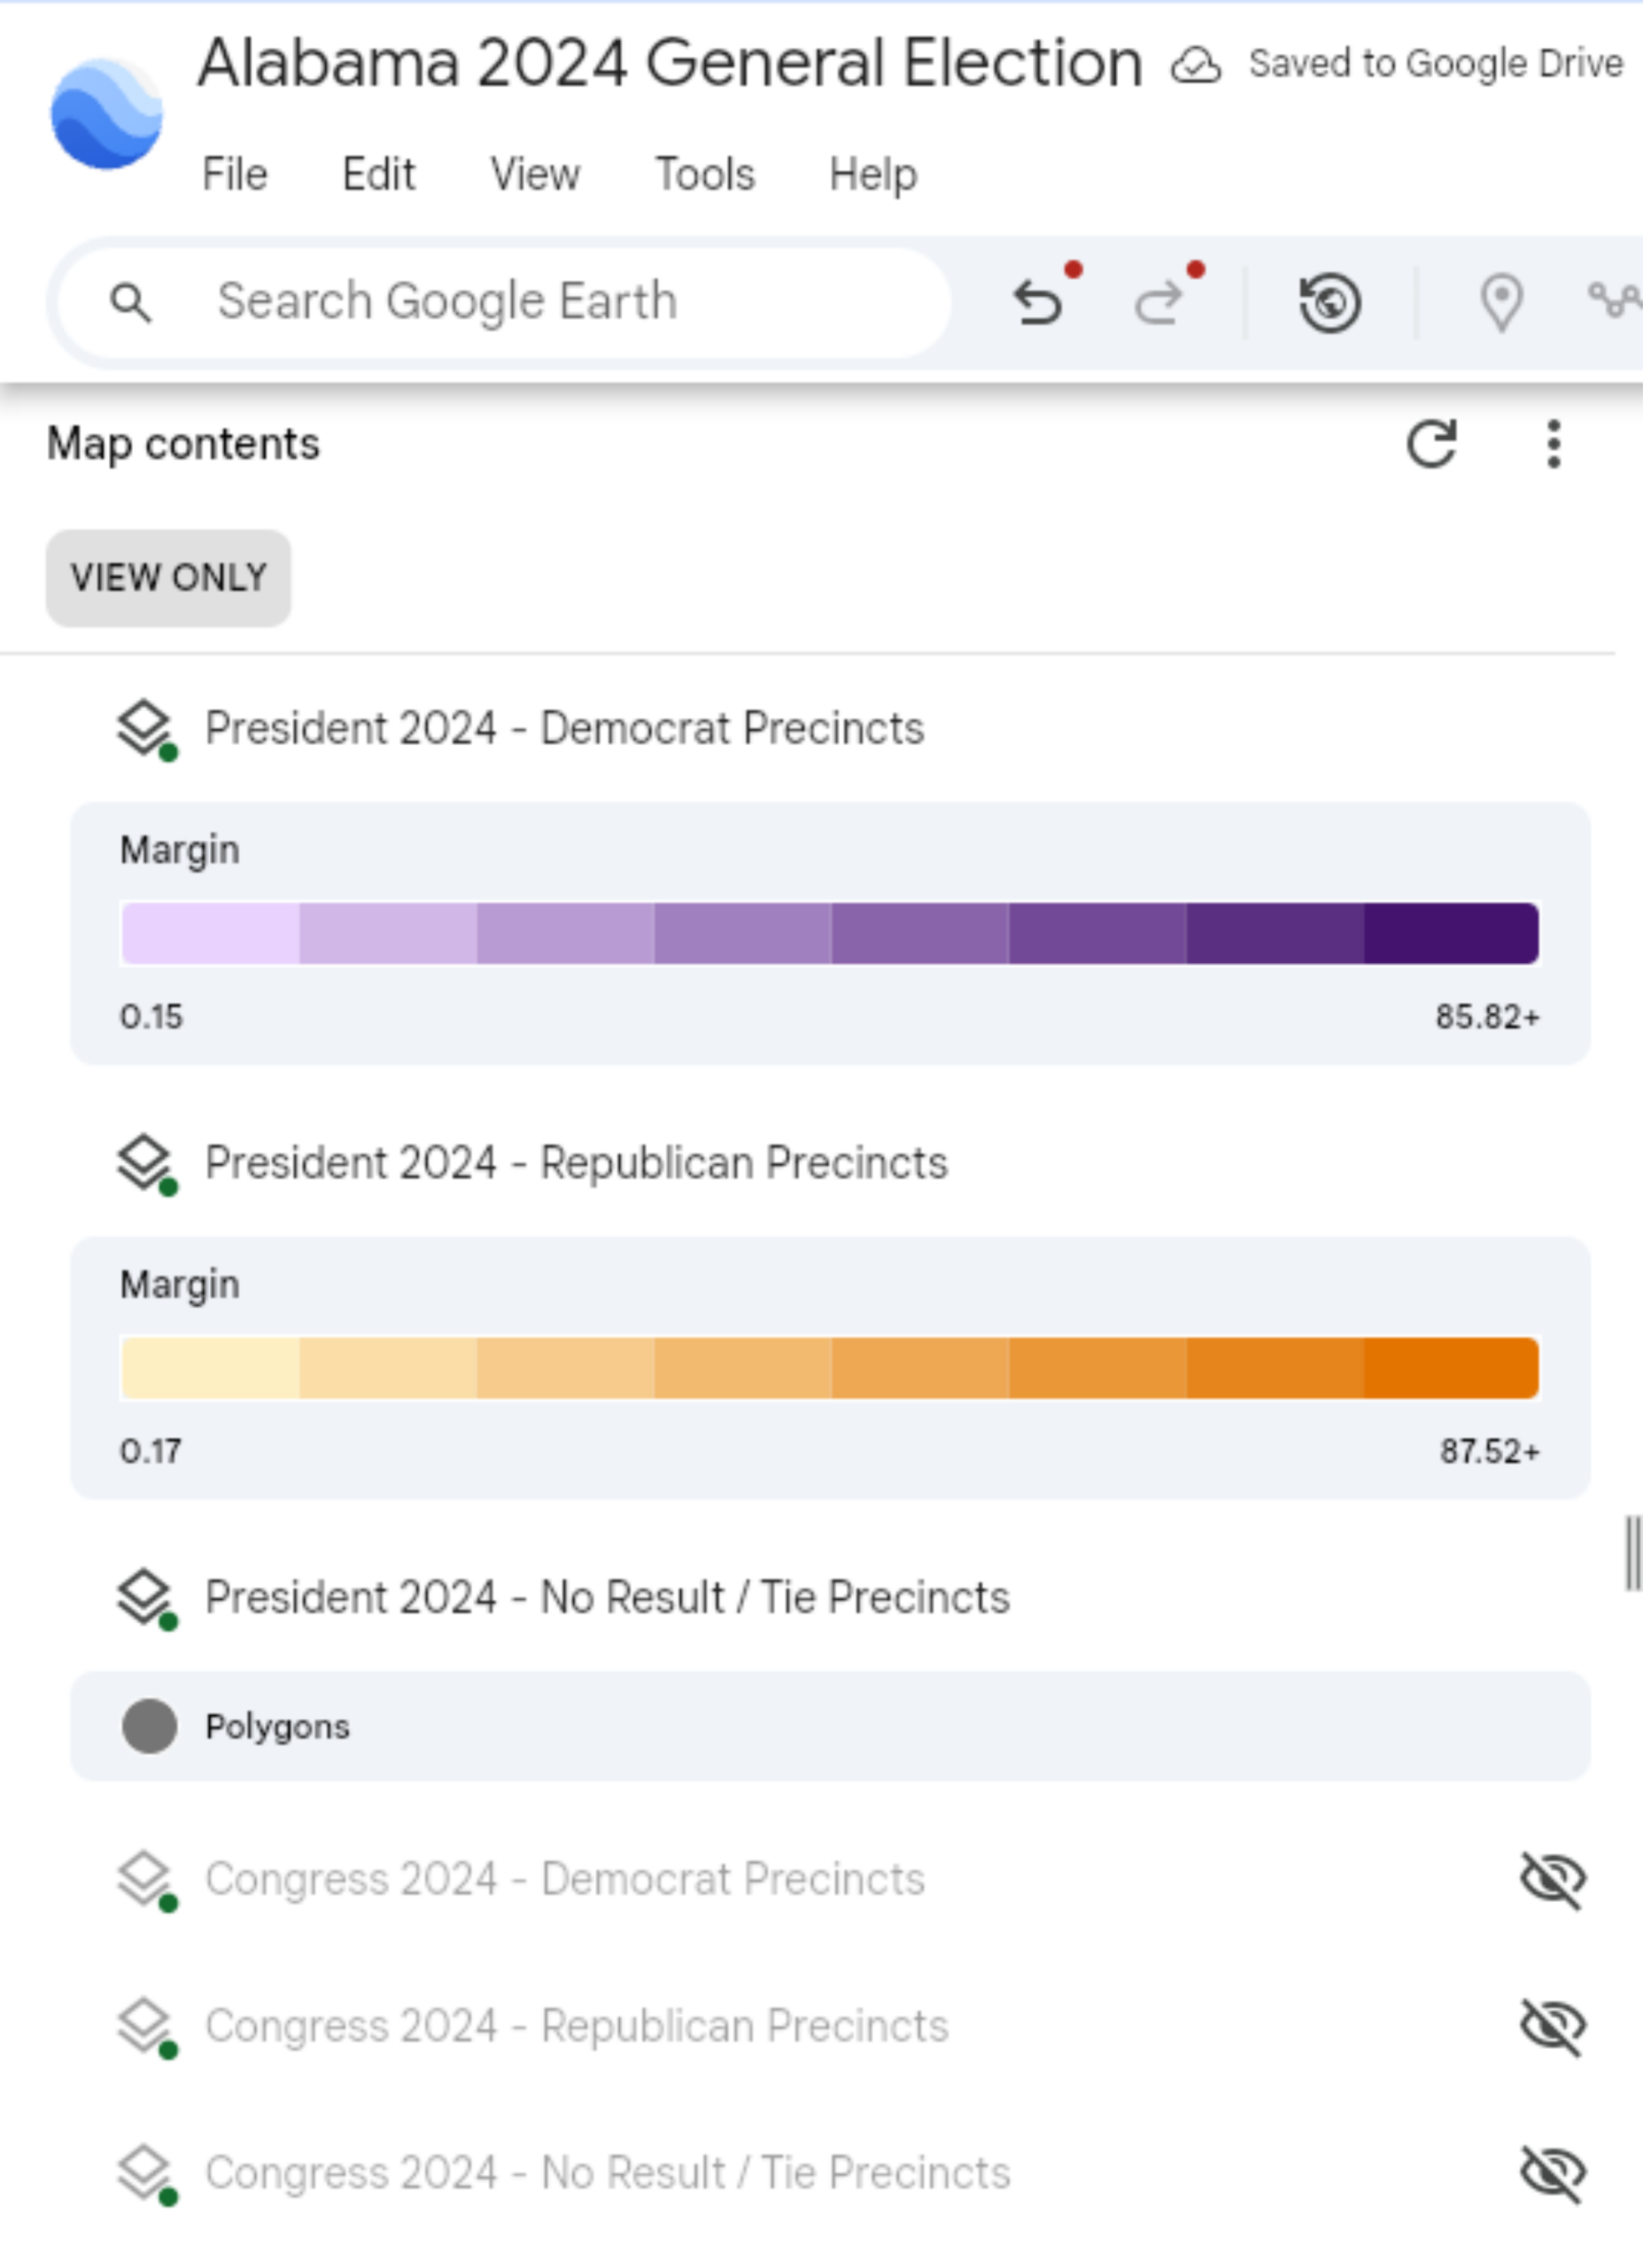
Because each contest comes as its own set of layers on this viewer, you must view one contest at a time. Results are currently available for President, U.S. House, State Senate, and State House.
Contest sets are composed of separate layers for precincts won by Democrats, Republicans, and those with no result or ties (where applicable). These layers are listed in the left-hand panel and can be toggled on and off using the eye icon that appears when you hover over a contest name. Layers that are turned on display the margin color gradient, while those that are off do not.
Turn on the purple and orange layers for the contest of interest, and turn off every layer belonging to the others. This is very important, because leaving multiple contests on stacks the layers, displaying one and hiding others completely. There is no visual sign this has happened – you will simply be looking at a different race than you think, and the popup will show that race’s numbers. If in doubt, be sure to check the contest name at the top of the popup and the layer list.
Split Precincts
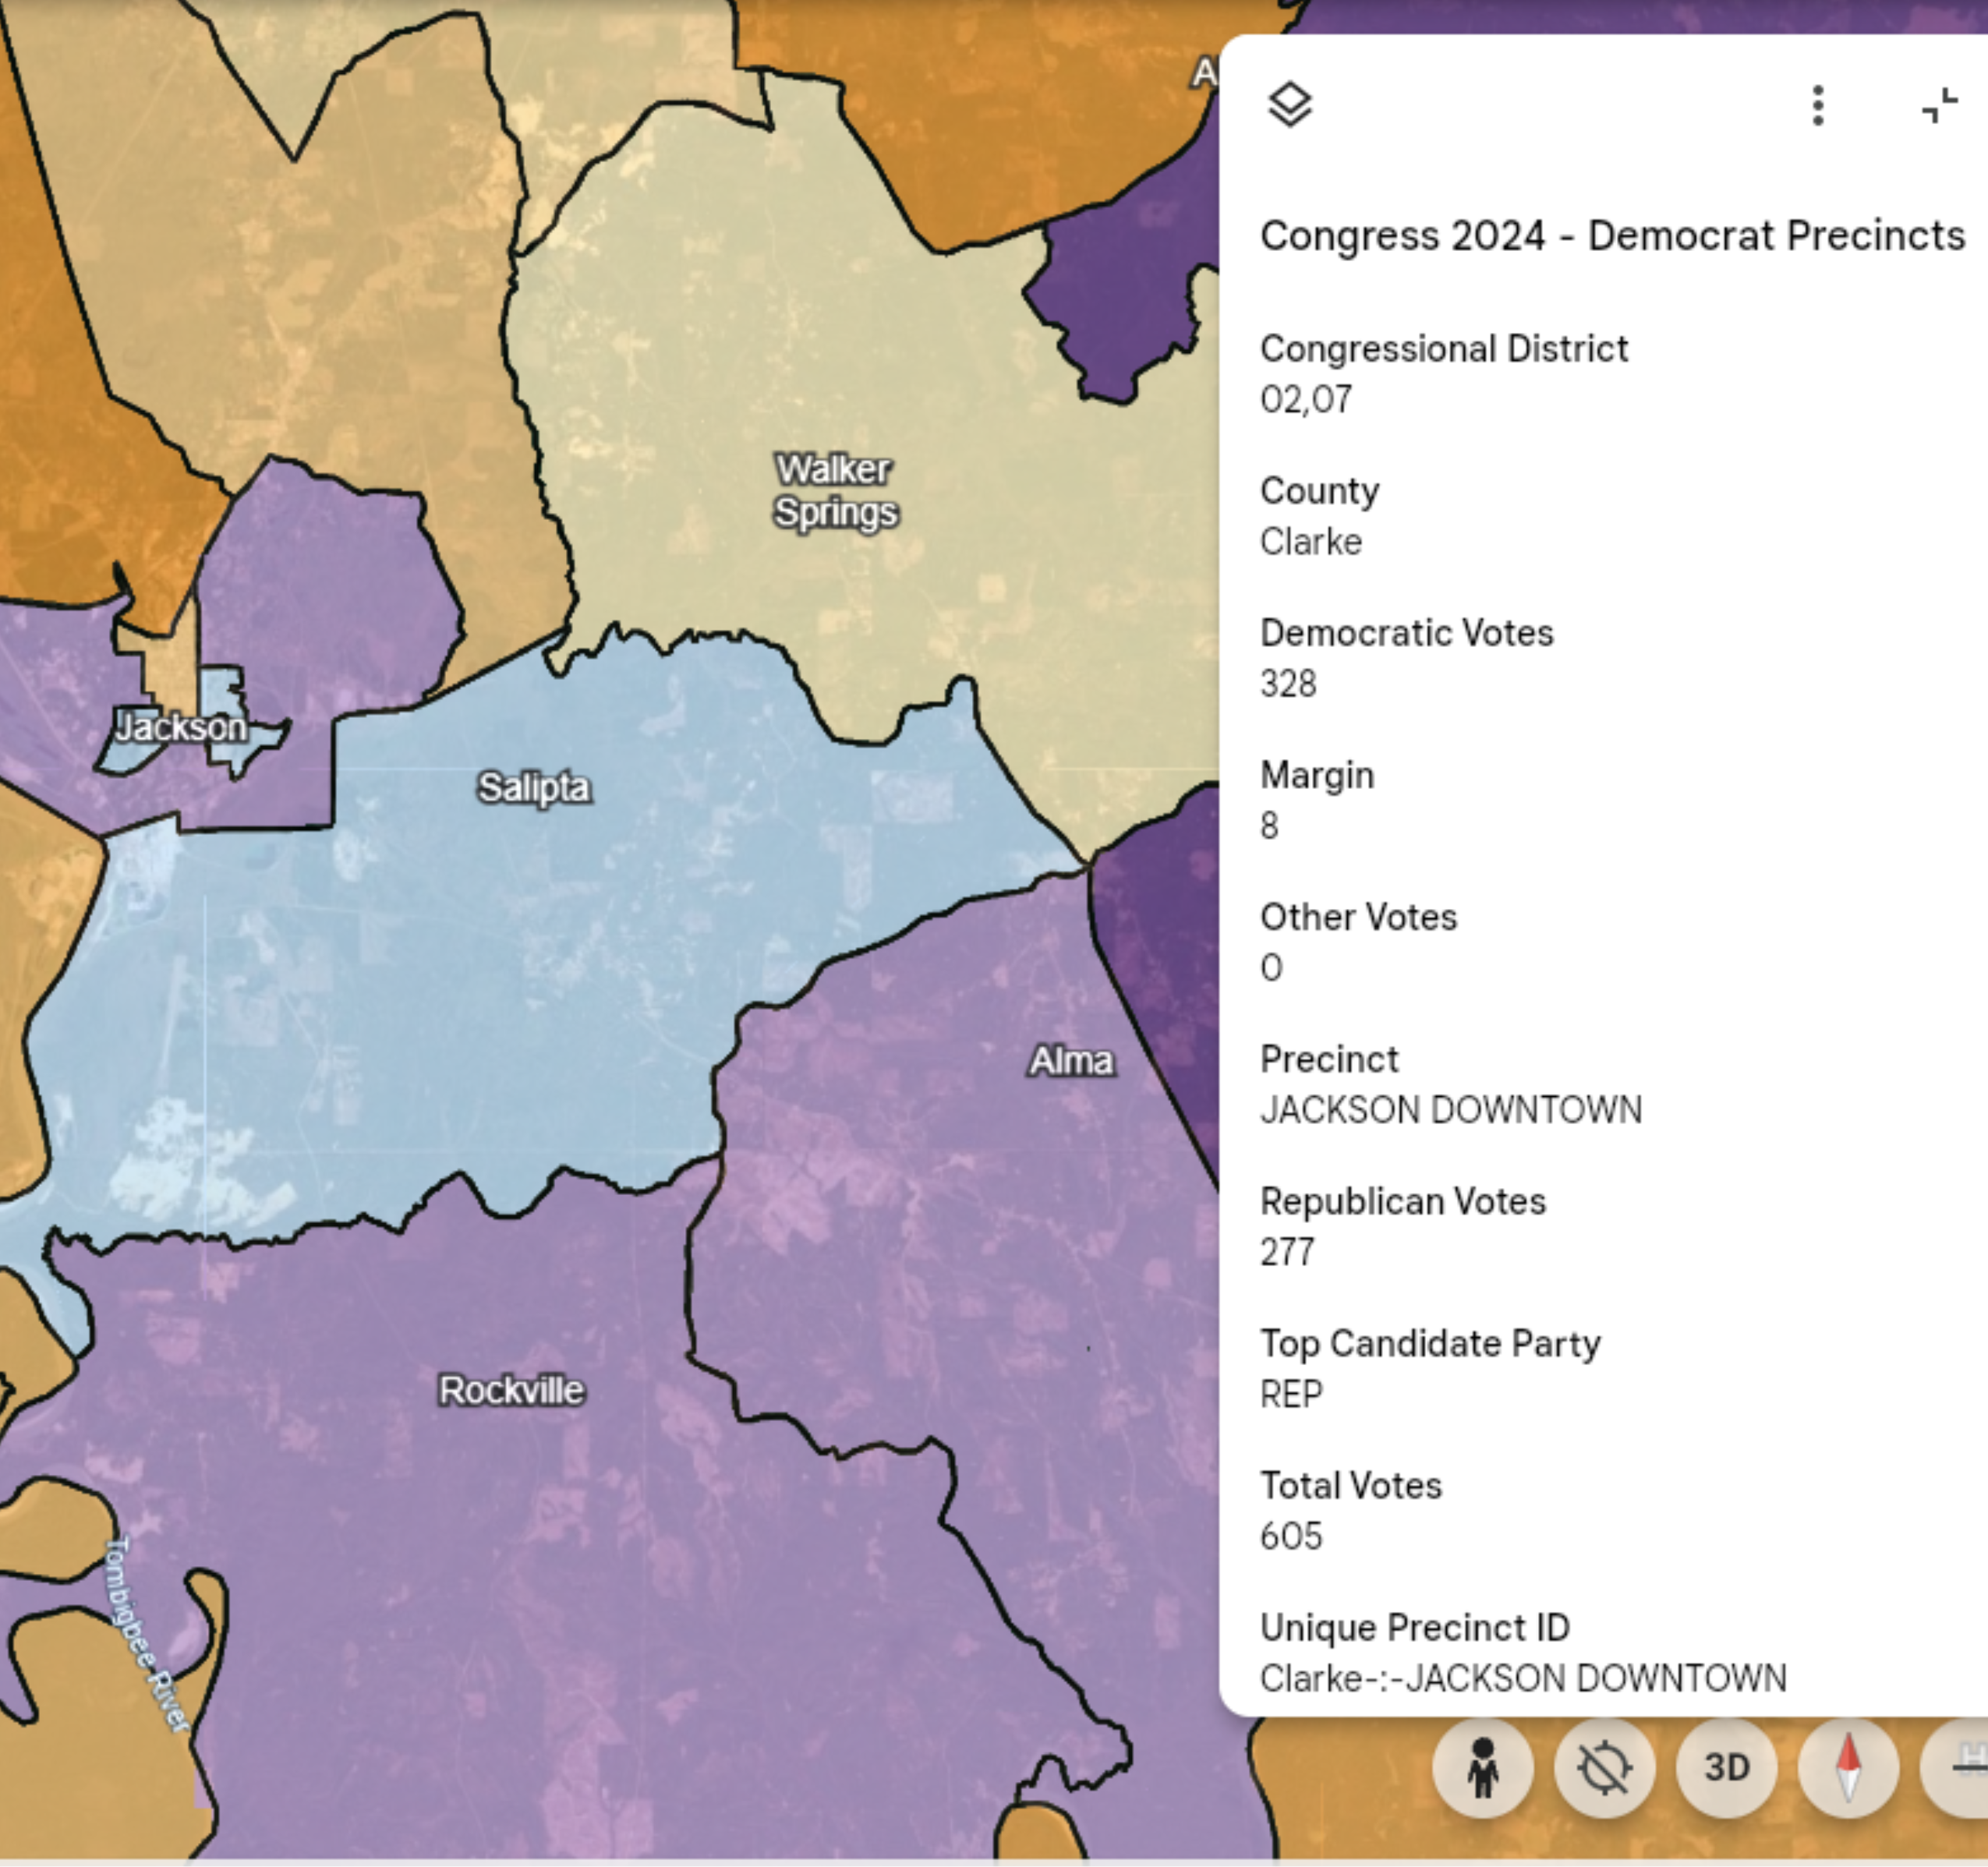
Some precincts span multiple districts. Where that happens, the District field lists both, and the votes shown are the combined total. This can make the Top Candidate Party disagree with the map color, but both are correct.
For example, Jackson Downtown in Clarke County, Alabama is split between Congressional Districts 2 and 7. The Republican leads in District 2, the Democrat in District 7, and the combined total is democratic, so it shows purple – but the single highest-scoring candidate is the District 2 Republican.
Frequently Asked Questions
How are results from third party candidates accounted for?
Libertarian, Green Independent, and write-in votes are combined into “Other Votes”. No precinct in these states was won by a third-party candidate.
How do the maps display results for uncontested races?
Uncontested races show as full-intensity wins. Where only one major party ran, its candidate takes essentially all of the two-party vote.
How does the Louisiana file differ from the others?
Louisiana uses a majority-vote system with an all-party primary for state legislative, state executive, and congressional contests. Several candidates from the same party can be on one ballot, so Louisiana’s margin compares combined Democratic votes against combined Republican votes rather than comparing votes received by two individual candidates.
How was the data in these maps verified?
Party totals were independently recomputed from the source shapefiles and match exactly. Statewide presidential totals match certified 2024 results in all five states. Every precinct appears in exactly one map layer, per contest.