Used for state legislative redistricting
The expanded report provides a detailed breakdown of the PL 94-171 data as released by the Census Bureau, compared to the reallocated, or adjusted data, provided by the state’s official redistricting body.
Specifically, this report details the differences in total population by census block, block group, tract, county, and state before and after reallocation. In states where comparisons are possible, these population differences are broken down by race and ethnicity.
DownloadMontana uses adjusted (or modified) data for state legislative redistricting
Even in states where the total population is unchanged, the distribution of the population within the state can be affected.
To give you a sense for how these population shifts affect Montana’s redistricting, the average district sizes in Montana are:
The dataset used to create this report is the official redistricting dataset.
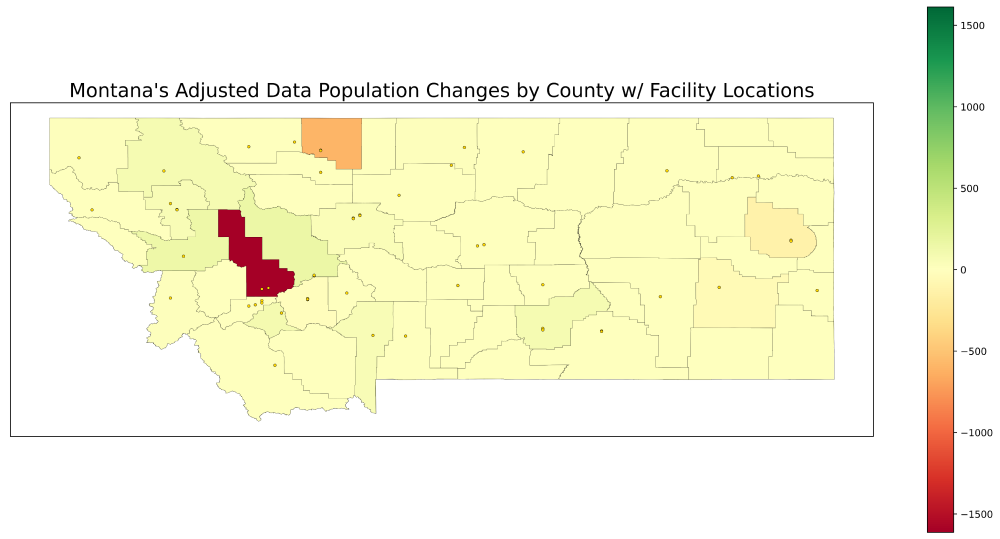
See the appendix for a detailed breakdown of county level population changes.
In general, the changes in block population are not uniform: most blocks are unaffected by modification, while a handful of blocks lose a large amount of population that goes to a larger number of blocks in smaller quantities.
| Population Change | Number of Blocks |
|---|---|
| Gained 100+ | 0 |
| Gained 51-100 | 0 |
| Gained 11-50 | 0 |
| Gained 6-10 | 5 |
| Gained 1-5 | 1,069 |
| No Change | 87,336 |
| Lost 1-5 | 0 |
| Lost 6-10 | 0 |
| Lost 11-50 | 1 |
| Lost 51-100 | 1 |
| Lost 100+ | 5 |
The official language for Montana’s adjustment is:
Inmate Reallocation DRAFT RFP — 12/10/21 meeting revisions
The commission seeks to adjust the Public Law 94-171 redistricting data (P. L. 94-171 data) to reallocate incarcerated individuals from the prison facilities in which they were held to their last known residence when possible. The adjusted data will be used when the commission draws state legislative districts in 2022 and at the start of 2023. The commission recognizes that Montana is limited in our ability to complete comprehensive inmate data reallocation, due to missing residential addresses for many incarcerated individuals. The Montana Department of Corrections currently does not collect last known residence information from inmates on intake into a prison facility. As a result, the residential address information in its offender management system is derived from any address information collected from individuals who have previously been under probation or parole supervision in the community and might be old or incomplete for the purposes of reallocation. The state also does not have residential address information for federal prisoners who were housed in facilities in Montana on Census Day.
The commission seeks an experienced technical contractor to complete the inmate data reallocation process by adjusting P. L. 94-171 data for Montana’s roughly 2,829 state inmates incarcerated in seven facilities on April 1, 2020, as well as the federal inmates. Roughly 1,132 inmates have residential addresses and the remaining do not have a last known address on file or have a previous prison facility listed as the last known address. Inmates without residential addresses and those with addresses that cannot be geocoded and reallocated to their smallest geographic unit will be excluded from the Census numbers that the commission will use to draw state legislative lines.
Eight categories of race data were used, the total of these racial groups adds up to 100 percent.
| County | Adjusted Population Diff. | 1 White | 2 Black | 3 Asian | 4 American Indian | 5 Pacific Islander | 6 Some Other Race | 7 Other multiple-race | 8 Hispanic |
|---|---|---|---|---|---|---|---|---|---|
| Lewis and Clark | 159 | 87.4% | 0.8% | 1.4% | 4.5% | 0.2% | 1.7% | 0.3% | 3.7% |
| Missoula | 149 | 84.8% | 1.1% | 2.0% | 4.8% | 0.2% | 1.6% | 0.3% | 5.1% |
| Silver Bow | 100 | 88.5% | 0.6% | 1.0% | 3.5% | 0.2% | 1.5% | 0.1% | 4.7% |
| Yellowstone | 87 | 82.9% | 1.3% | 1.3% | 6.2% | 0.2% | 1.4% | 0.4% | 6.1% |
| Flathead | 81 | 89.5% | 0.6% | 1.3% | 3.3% | 0.2% | 1.7% | 0.2% | 3.2% |
| Lake | 57 | 65.4% | 0.4% | 0.8% | 27.7% | 0.1% | 1.2% | 0.5% | 3.8% |
| Gallatin | 51 | 87.4% | 0.8% | 2.1% | 2.4% | 0.1% | 2.0% | 0.2% | 5.0% |
| Cascade | 40 | 81.5% | 2.0% | 1.8% | 7.6% | 0.2% | 1.6% | 0.6% | 4.8% |
| Hill | 19 | 67.6% | 0.6% | 1.0% | 25.9% | 0.1% | 1.1% | 0.6% | 3.1% |
| Lincoln | 14 | 90.1% | 0.5% | 0.9% | 3.7% | 0.2% | 1.6% | 0.2% | 2.9% |
| Ravalli | 14 | 89.9% | 0.5% | 1.0% | 2.8% | 0.1% | 2.0% | 0.1% | 3.6% |
| Deer Lodge | 11 | 90.4% | 0.4% | 0.7% | 4.4% | 0.0% | 1.1% | 0.2% | 2.8% |
| Fergus | 11 | 92.3% | 0.3% | 0.7% | 2.9% | 0.0% | 1.7% | 0.1% | 2.0% |
| Richland | 10 | 86.1% | 0.9% | 1.4% | 4.4% | 0.1% | 1.6% | 0.3% | 5.3% |
| Big Horn | 9 | 26.0% | 0.3% | 0.5% | 68.5% | 0.1% | 0.3% | 0.5% | 3.9% |
| Park | 7 | 91.0% | 0.6% | 0.9% | 2.9% | 0.0% | 1.5% | 0.2% | 3.0% |
| Rosebud | 7 | 57.2% | 0.3% | 0.6% | 37.6% | 0.0% | 0.7% | 0.6% | 2.8% |
| Glacier | 7 | 25.4% | 0.2% | 0.4% | 70.4% | 0.2% | 0.3% | 0.9% | 2.2% |
| Sanders | 7 | 86.5% | 0.4% | 0.8% | 6.8% | 0.0% | 2.4% | 0.3% | 2.8% |
| Stillwater | 6 | 90.5% | 0.3% | 0.6% | 2.7% | 0.1% | 2.6% | 0.2% | 3.0% |
| Broadwater | 6 | 90.8% | 0.7% | 0.3% | 3.0% | 0.1% | 2.0% | 0.2% | 3.0% |
| Blaine | 6 | 41.8% | 0.2% | 0.4% | 53.8% | 0.0% | 0.9% | 0.6% | 2.2% |
| Musselshell | 6 | 90.4% | 0.4% | 0.5% | 4.5% | 0.1% | 0.8% | 0.2% | 3.1% |
| Meagher | 4 | 92.4% | 0.8% | 0.5% | 1.9% | 0.1% | 1.1% | 0.7% | 2.4% |
| Beaverhead | 4 | 88.9% | 0.5% | 0.6% | 3.8% | 0.1% | 1.4% | 0.1% | 4.6% |
| Granite | 3 | 92.7% | 0.3% | 0.1% | 2.9% | 0.0% | 0.8% | 0.6% | 2.6% |
| Roosevelt | 3 | 33.2% | 0.5% | 0.7% | 62.3% | 0.0% | 0.6% | 0.5% | 2.2% |
| Carbon | 3 | 91.7% | 0.2% | 0.6% | 2.7% | 0.2% | 2.0% | 0.2% | 2.5% |
| Pondera | 3 | 78.7% | 0.4% | 0.5% | 17.6% | 0.3% | 0.7% | 0.1% | 1.6% |
| Valley | 2 | 83.8% | 0.4% | 0.4% | 11.6% | 0.1% | 0.9% | 0.4% | 2.3% |
| Chouteau | 2 | 70.8% | 0.4% | 0.7% | 24.2% | 0.0% | 0.9% | 0.3% | 2.7% |
| Teton | 2 | 90.8% | 0.8% | 0.4% | 4.6% | 0.2% | 1.6% | 0.2% | 1.4% |
| Fallon | 2 | 93.7% | 0.7% | 0.3% | 2.2% | 0.2% | 0.6% | 0.3% | 2.1% |
| Sweet Grass | 2 | 90.6% | 0.2% | 0.7% | 2.7% | 0.1% | 2.4% | 0.6% | 2.7% |
| Liberty | 1 | 94.7% | 0.4% | 0.7% | 1.7% | 0.3% | 1.1% | 0.4% | 0.7% |
| Madison | 1 | 92.3% | 0.2% | 0.7% | 2.2% | 0.2% | 1.5% | 0.2% | 2.8% |
| Wibaux | 1 | 91.7% | 0.3% | 0.7% | 0.7% | 0.2% | 1.9% | 1.5% | 2.9% |
| Judith Basin | 1 | 93.1% | 0.5% | 0.4% | 1.2% | 0.1% | 1.5% | 0.7% | 2.4% |
| Powder River | 1 | 90.3% | 0.4% | 0.0% | 4.8% | 0.1% | 2.1% | 0.4% | 2.1% |
| McCone | 1 | 92.1% | 0.2% | 1.0% | 2.4% | 0.2% | 1.8% | 0.5% | 1.9% |
| Mineral | 1 | 89.2% | 0.5% | 0.9% | 4.1% | 0.1% | 1.5% | 0.5% | 3.2% |
| Prairie | 1 | 90.3% | 0.2% | 0.9% | 3.6% | 0.0% | 0.8% | 1.2% | 3.0% |
| Garfield | 1 | 95.9% | 0.0% | 0.2% | 1.8% | 0.1% | 0.2% | 0.7% | 1.2% |
| Phillips | 0 | 82.8% | 0.2% | 0.5% | 11.4% | 0.0% | 1.8% | 0.6% | 2.7% |
| Wheatland | 0 | 89.4% | 0.5% | 0.3% | 3.4% | 0.3% | 2.4% | 0.3% | 3.3% |
| Treasure | 0 | 90.3% | 0.9% | 0.4% | 2.8% | 0.1% | 0.4% | 1.0% | 4.1% |
| Carter | 0 | 94.8% | 0.2% | 0.7% | 1.5% | 0.1% | 1.1% | 0.9% | 0.8% |
| Golden Valley | 0 | 88.0% | 1.0% | 0.0% | 2.3% | 0.1% | 3.6% | 0.7% | 4.3% |
| Sheridan | 0 | 89.6% | 0.8% | 0.6% | 4.5% | 0.0% | 1.3% | 0.3% | 3.0% |
| Petroleum | 0 | 94.0% | 1.0% | 0.2% | 2.2% | 0.8% | 0.0% | 0.8% | 1.0% |
| Daniels | 0 | 88.3% | 0.4% | 1.4% | 4.6% | 0.1% | 1.1% | 1.2% | 3.0% |
| Jefferson | -16 | 90.4% | 0.4% | 0.9% | 3.7% | 0.1% | 1.9% | 0.2% | 2.4% |
| Custer | -54 | 90.2% | 0.9% | 1.0% | 3.6% | 0.2% | 1.1% | 0.1% | 3.1% |
| Dawson | -131 | 89.1% | 0.8% | 0.9% | 4.0% | 0.0% | 1.7% | 0.2% | 3.2% |
| Toole | -597 | 84.1% | 0.8% | 1.1% | 9.3% | 0.0% | 1.0% | 0.2% | 3.6% |
| Powell | -1,613 | 86.6% | 1.4% | 0.5% | 7.8% | 0.1% | 1.0% | 0.3% | 2.3% |