Middle Eastern and North African (MENA) Populations
Reports on the detailed ethnicities that comprise the Middle Eastern and North African Populations.
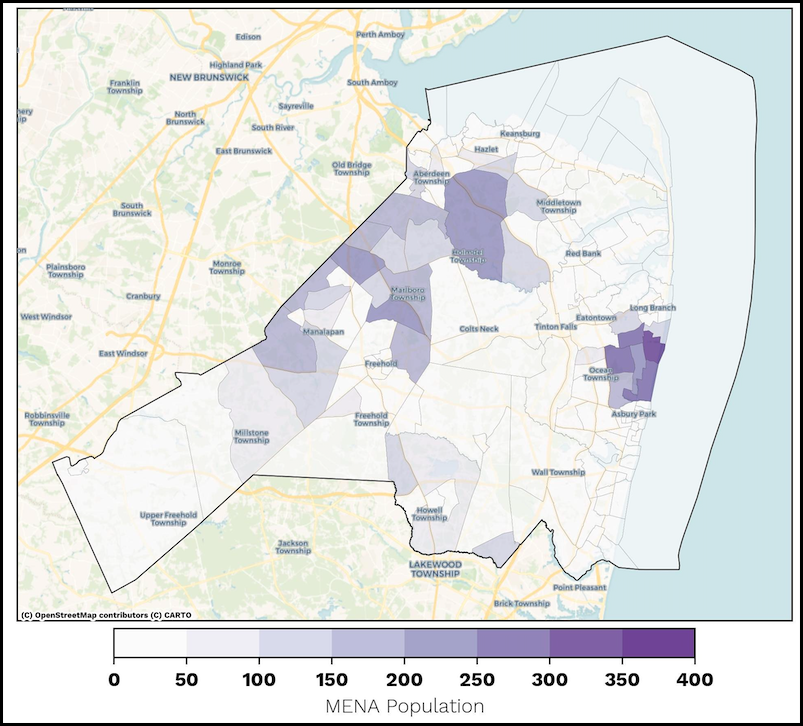
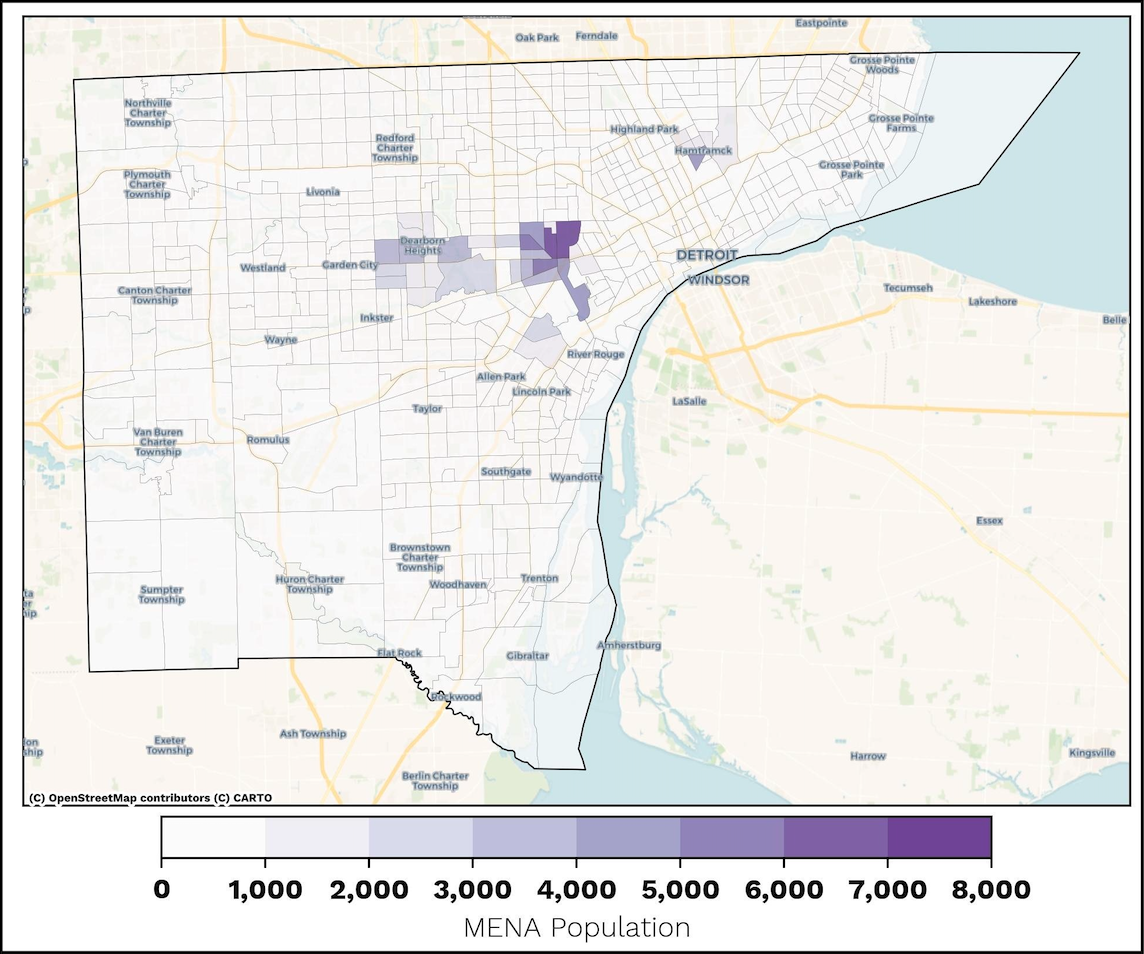
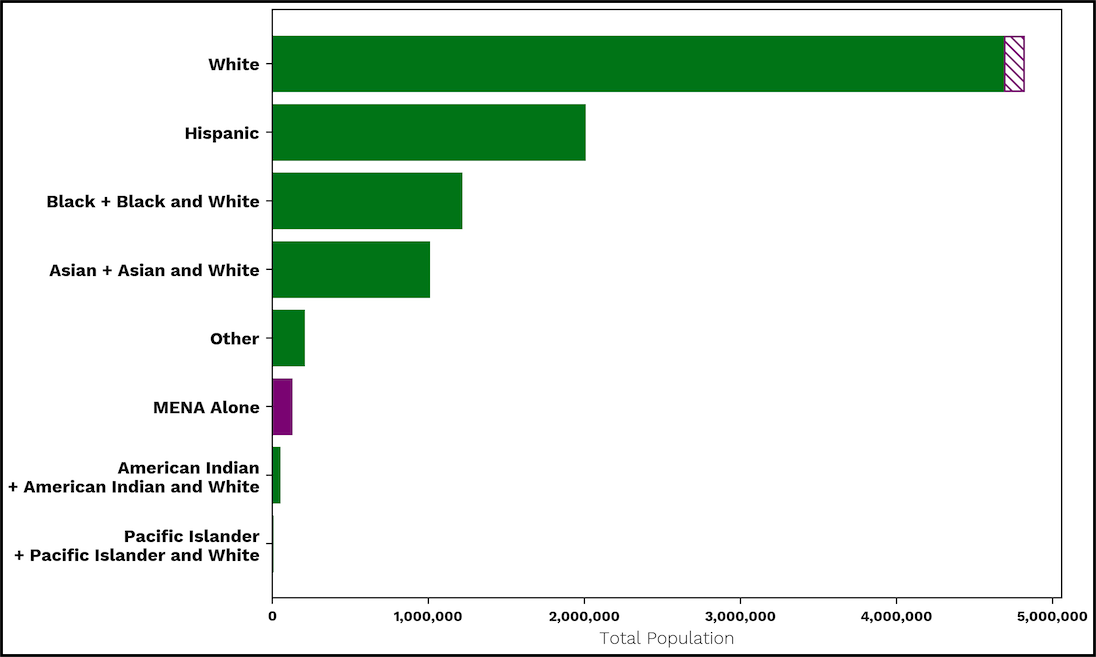
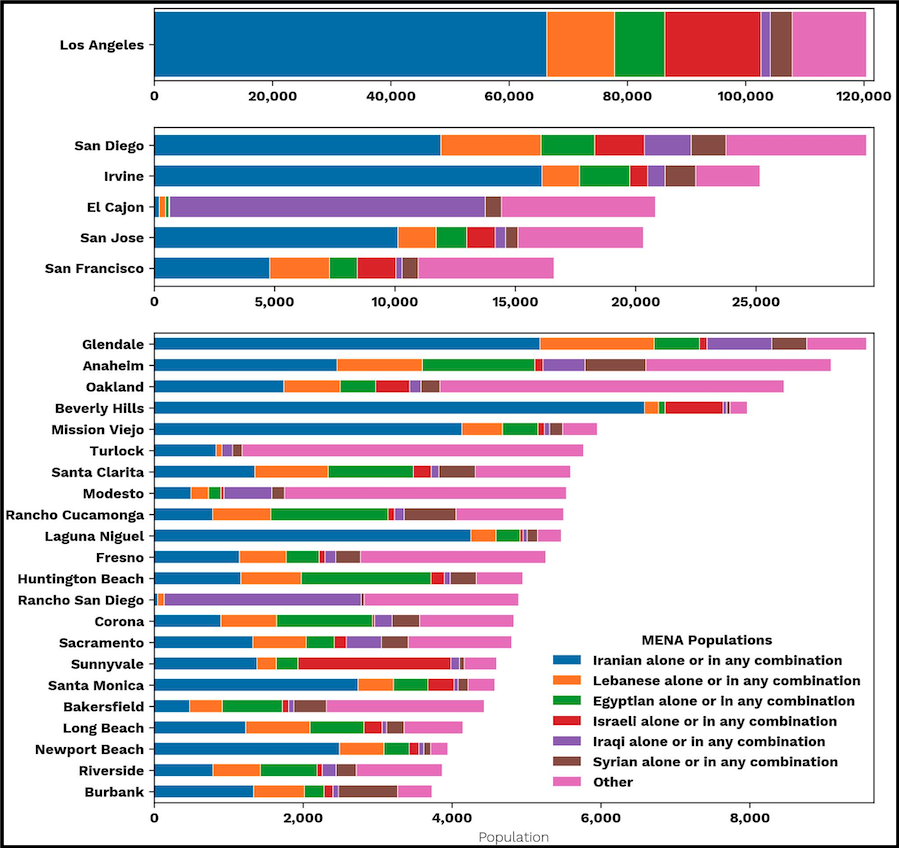
Using detailed ethnicity data provided by the U.S. Census Bureau, our team analyzed how many people identify with one or more MENA populations and where they live in 4 states: California, Illinois, Michigan, and New Jersey.
Prison Gerrymandering Reform Efforts
Reports on statewide prison gerrymandering and reforms in the 2021 redistricting cycle.
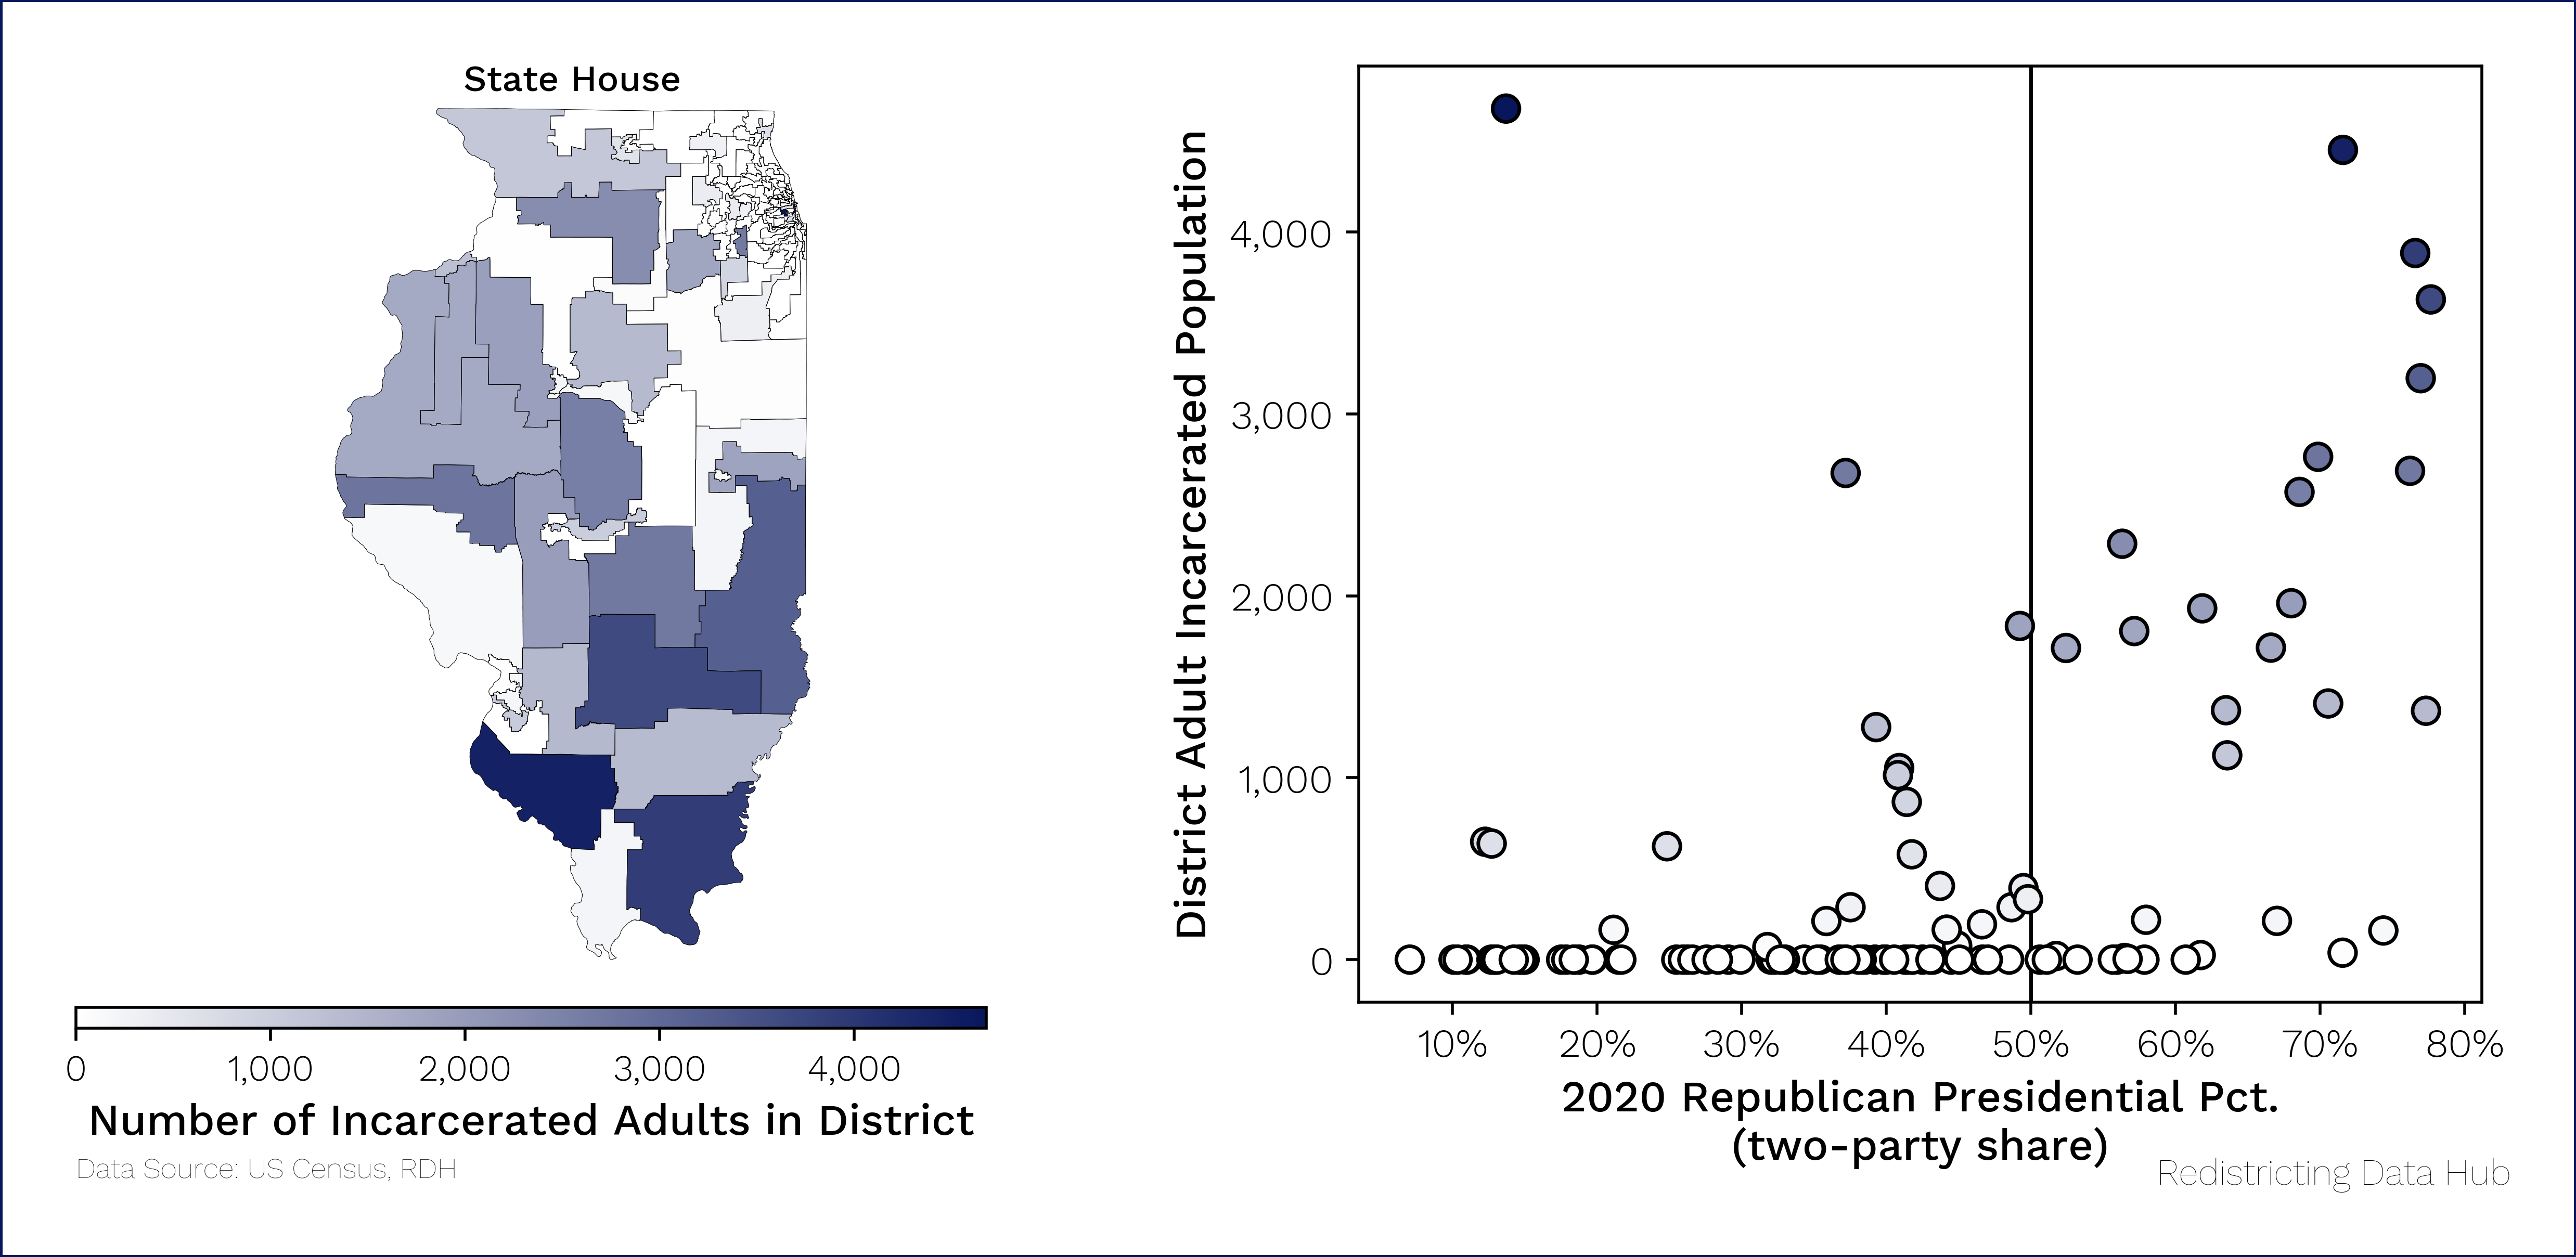
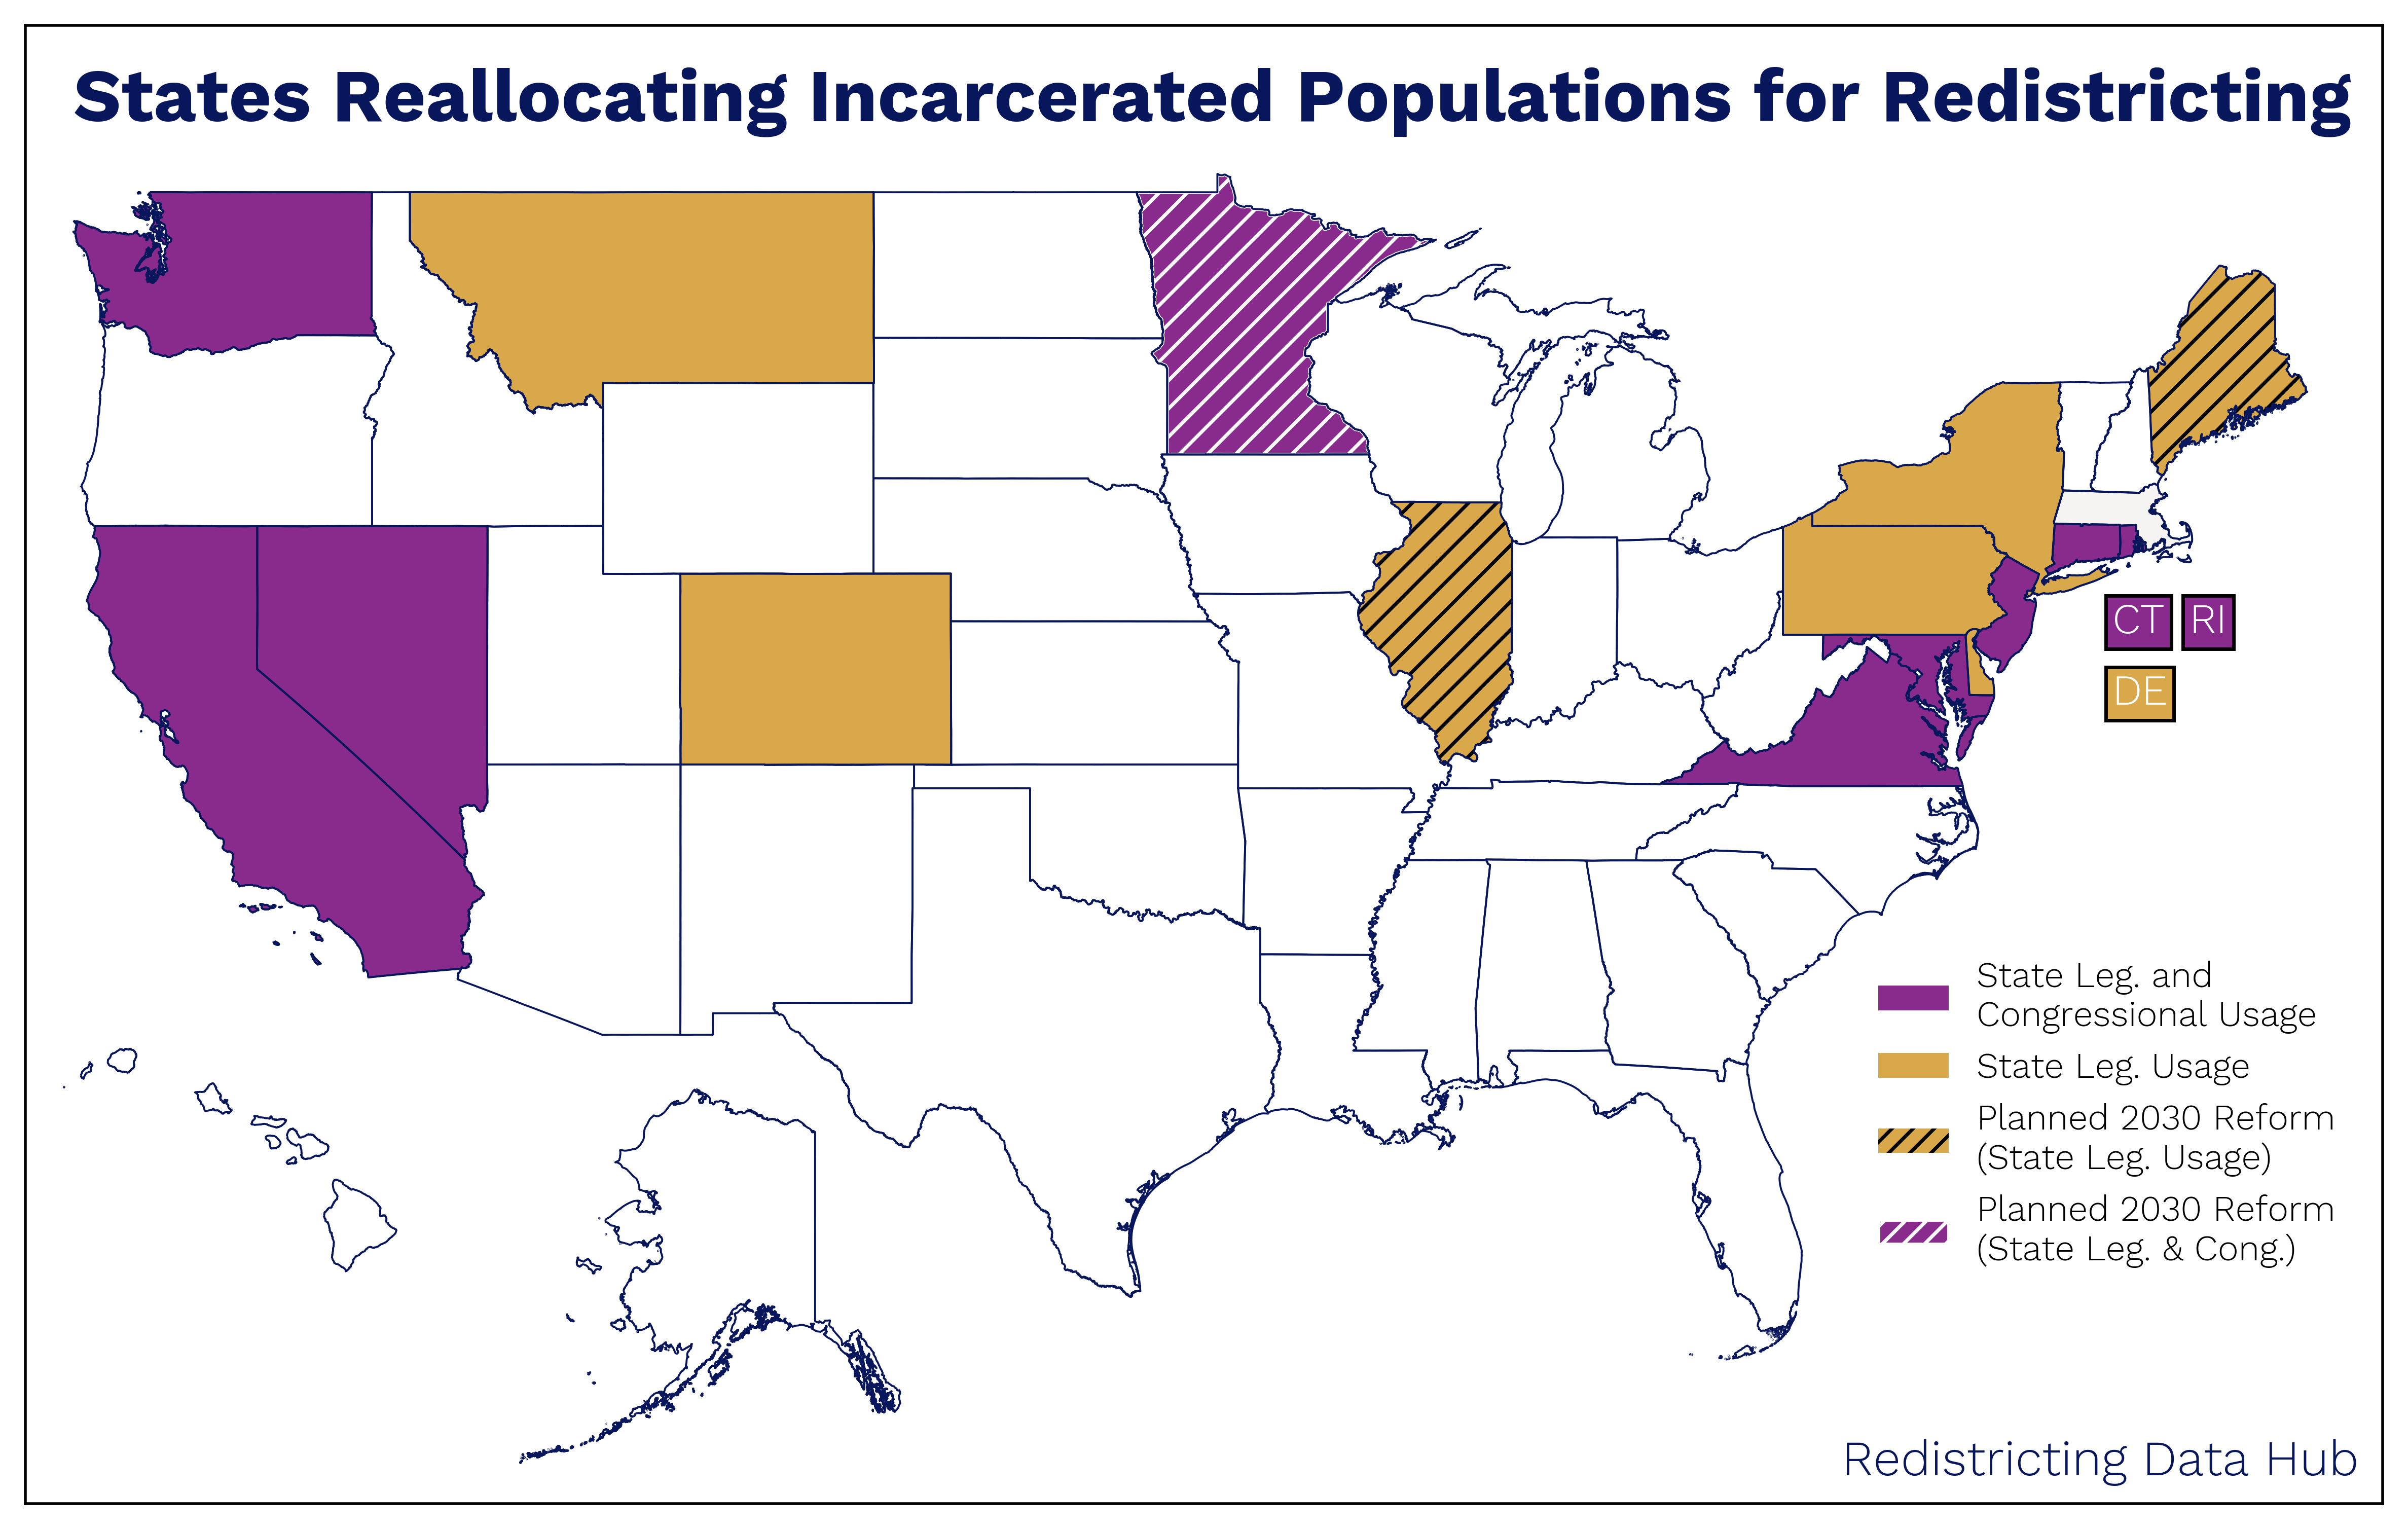
Read our national report focused on the 13 states that implemented statewide prison gerrymandering reform efforts in the 2021 redistricting cycle. You can also download one of our reports in 21 states without statewide reforms, estimating the impact of prison gerrymandering in the 2020 census and the 2021 redistricting cycle.
Request custom analysis
Do you work with a nonpartisan organization on redistricting or related civic engagement work and need help analyzing our data? Contact us to find out how we can help – whether it’s summarizing data, creating data visualizations, or finding insights that can make your work more efficient and streamlined – our team is ready to assist.
State Reports on the 2021 Redistricting Cycle
Reports on how the demographic, partisan, and political makeup of state legislative and congressional districts changed as a result of the 2021 redistricting cycle.
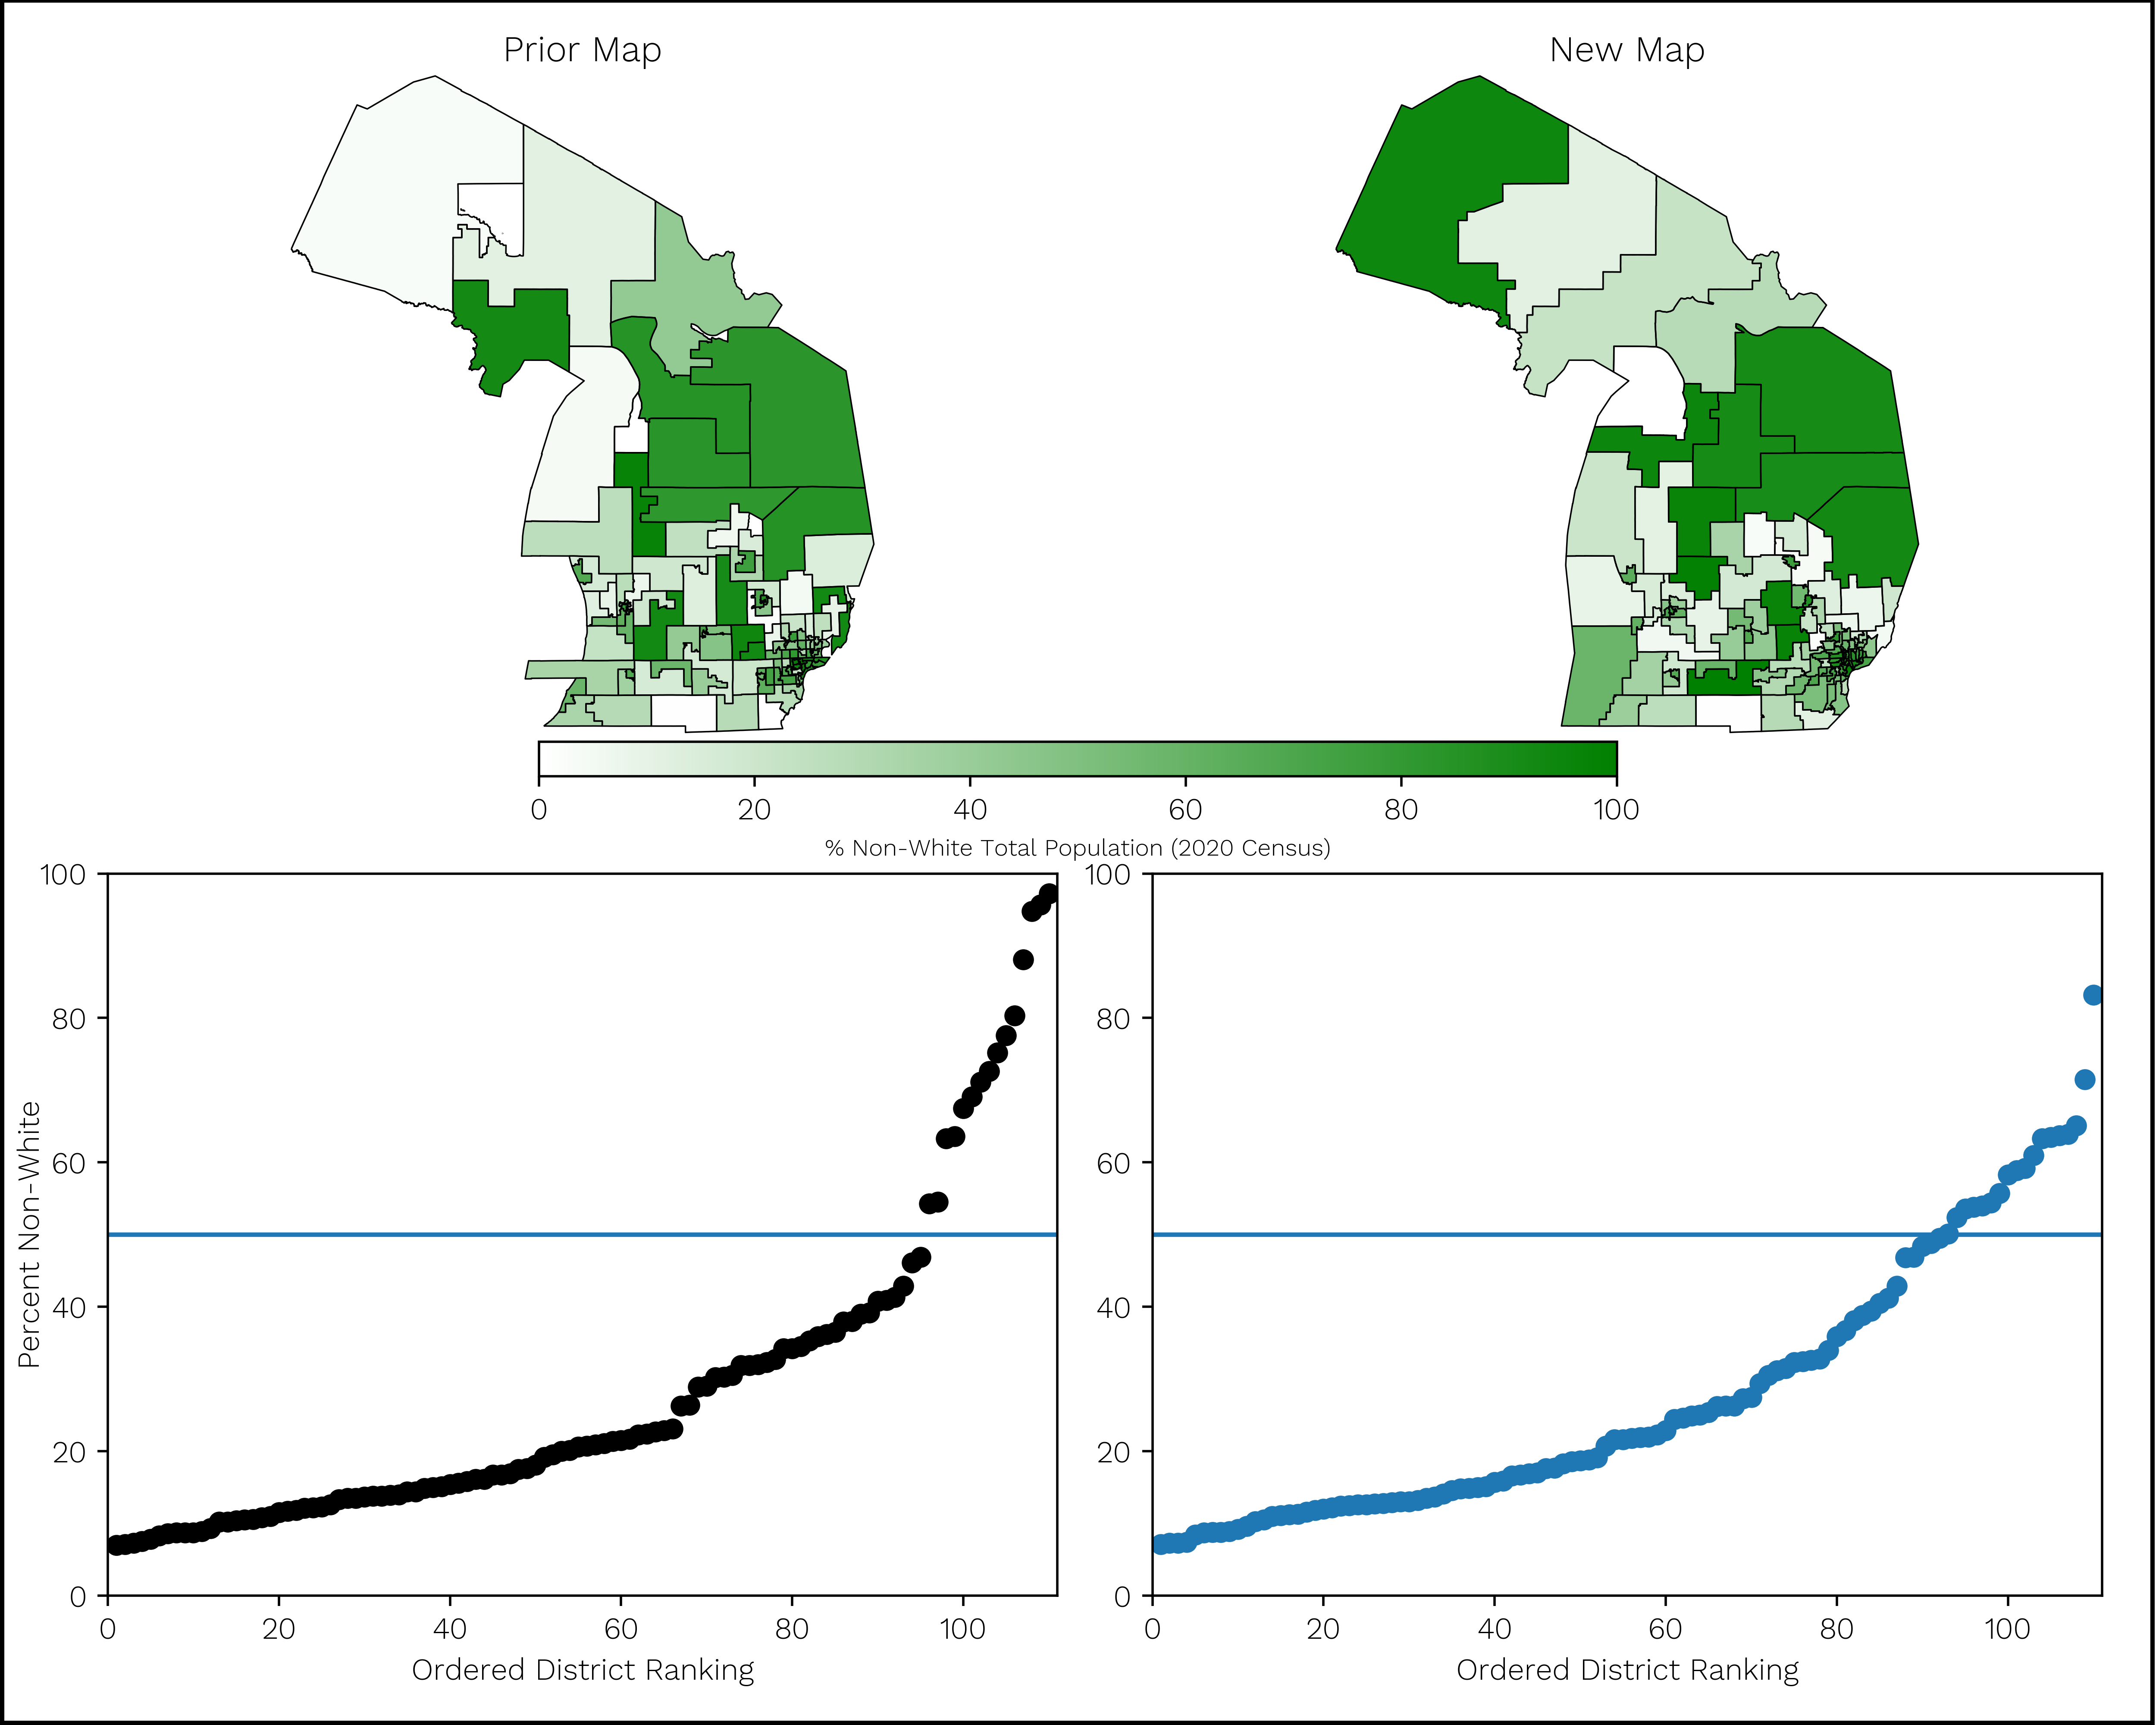
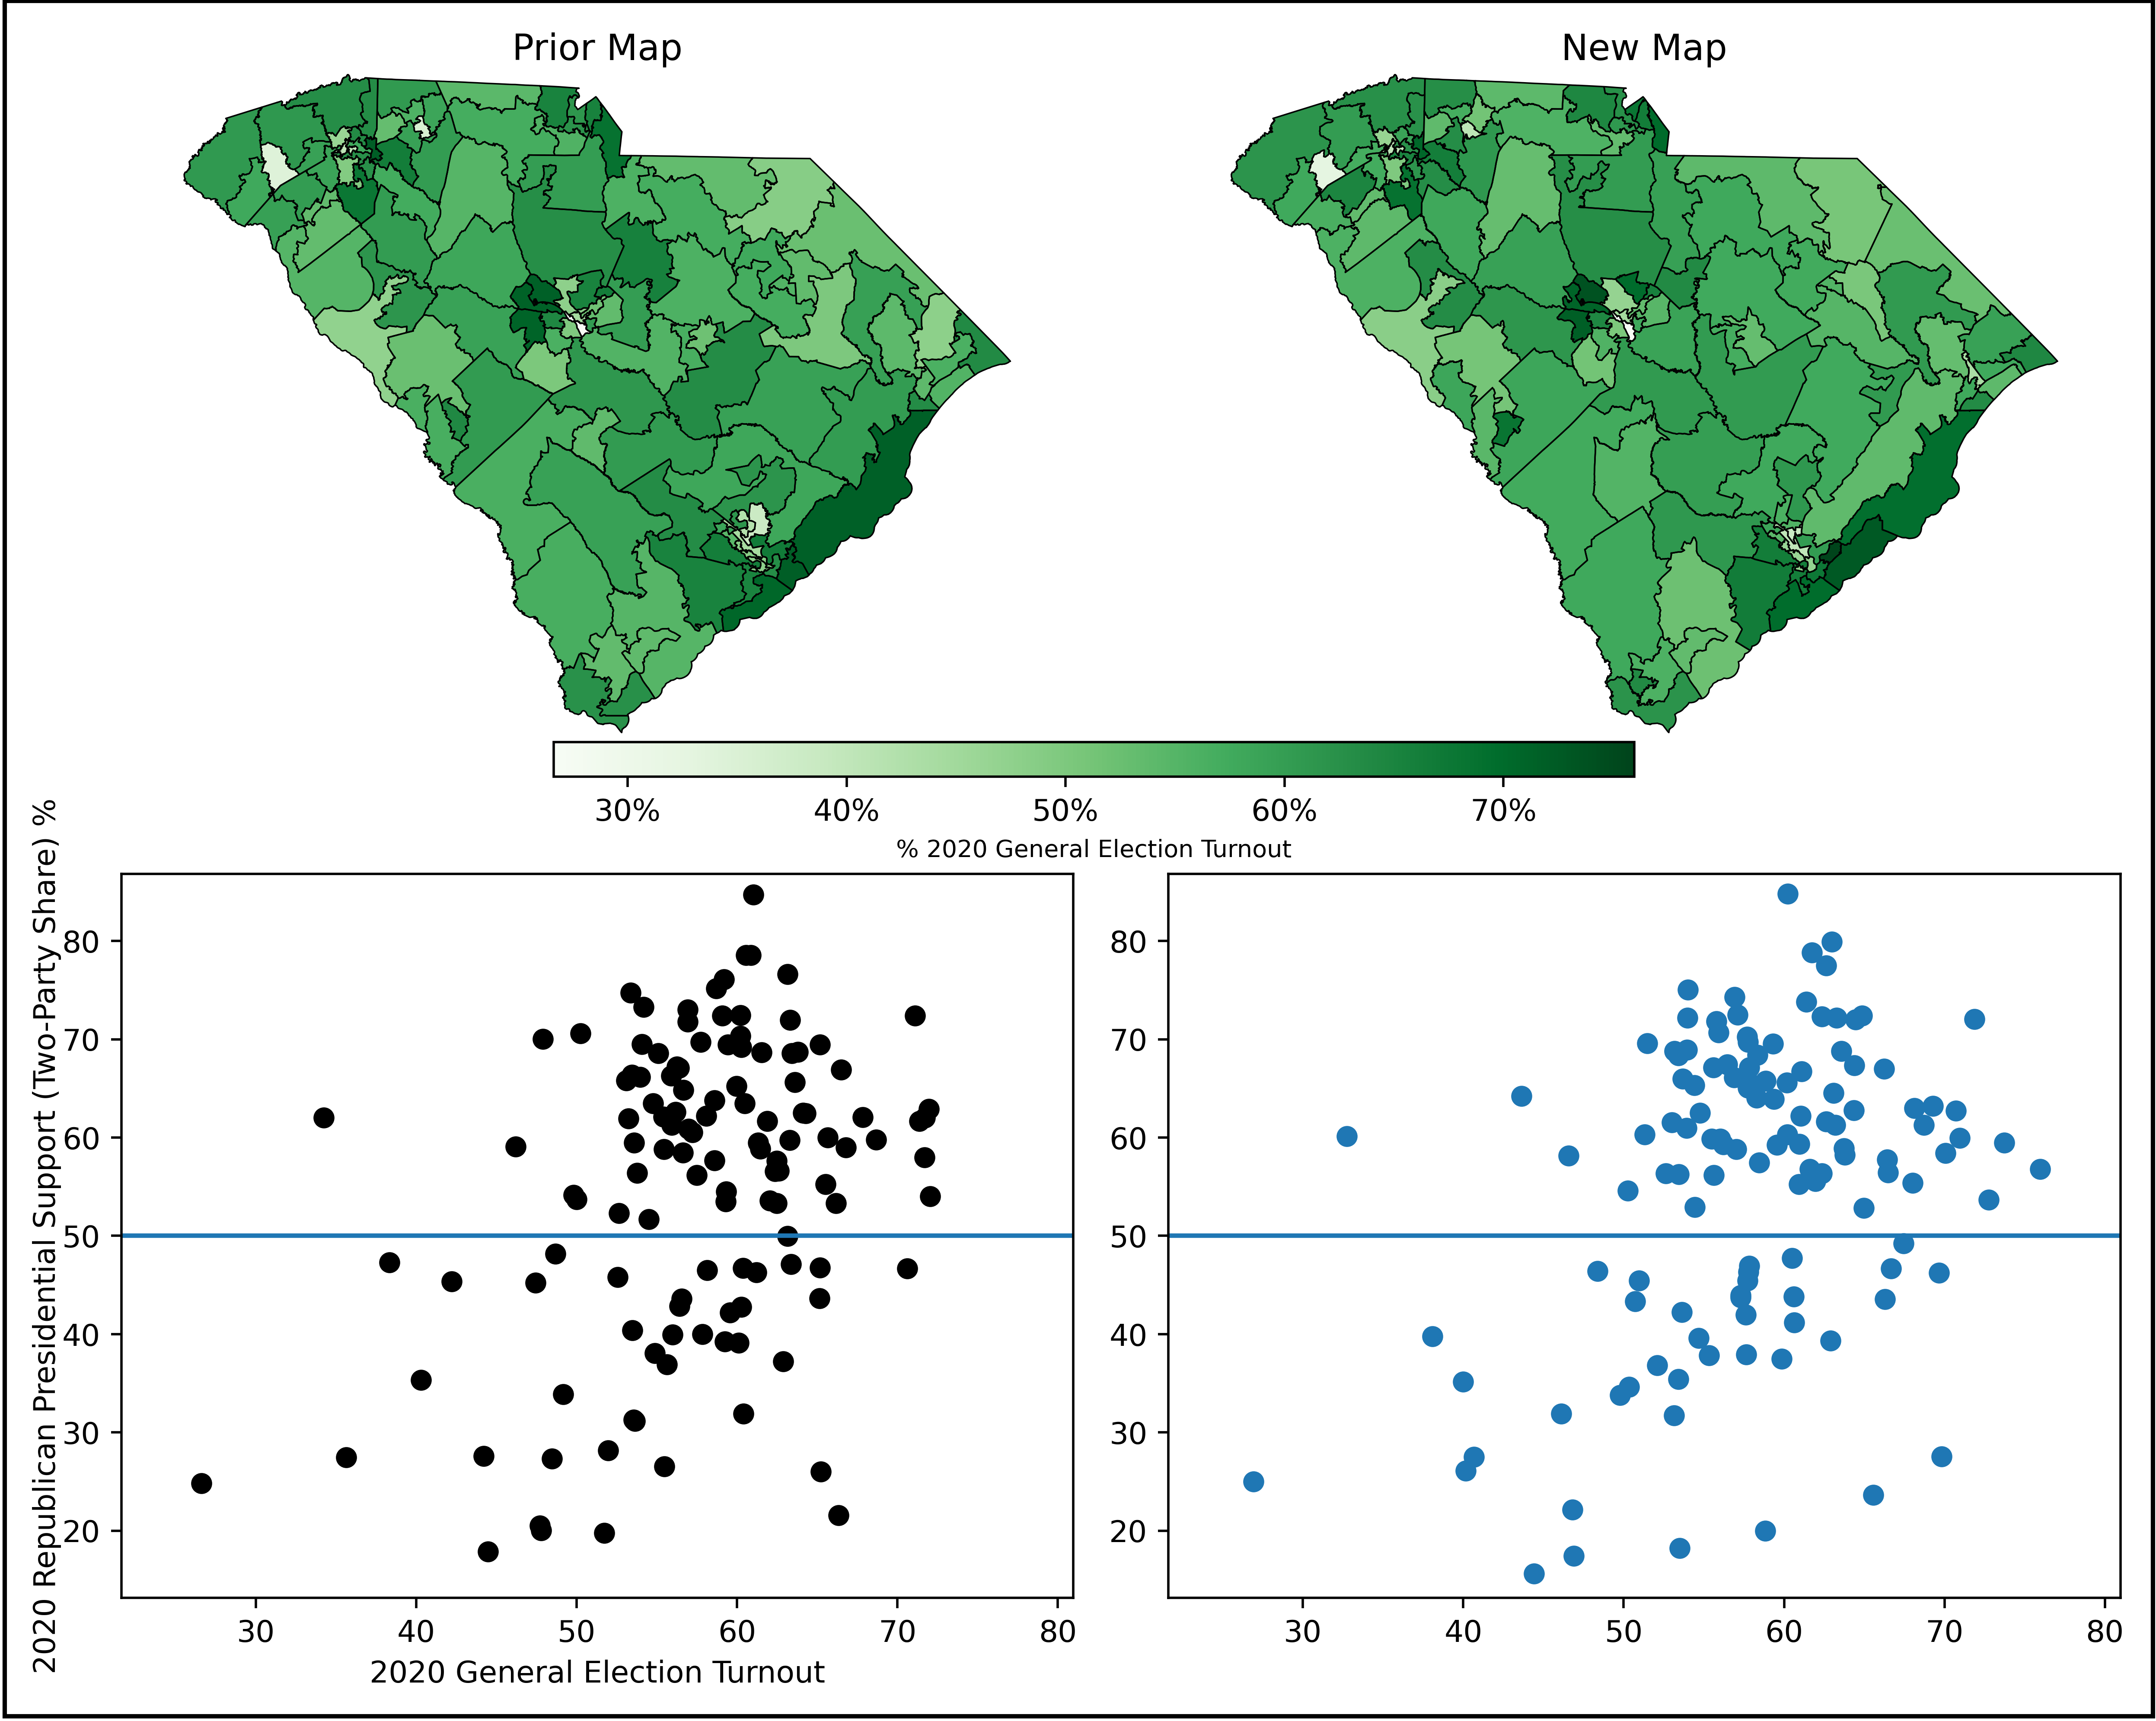
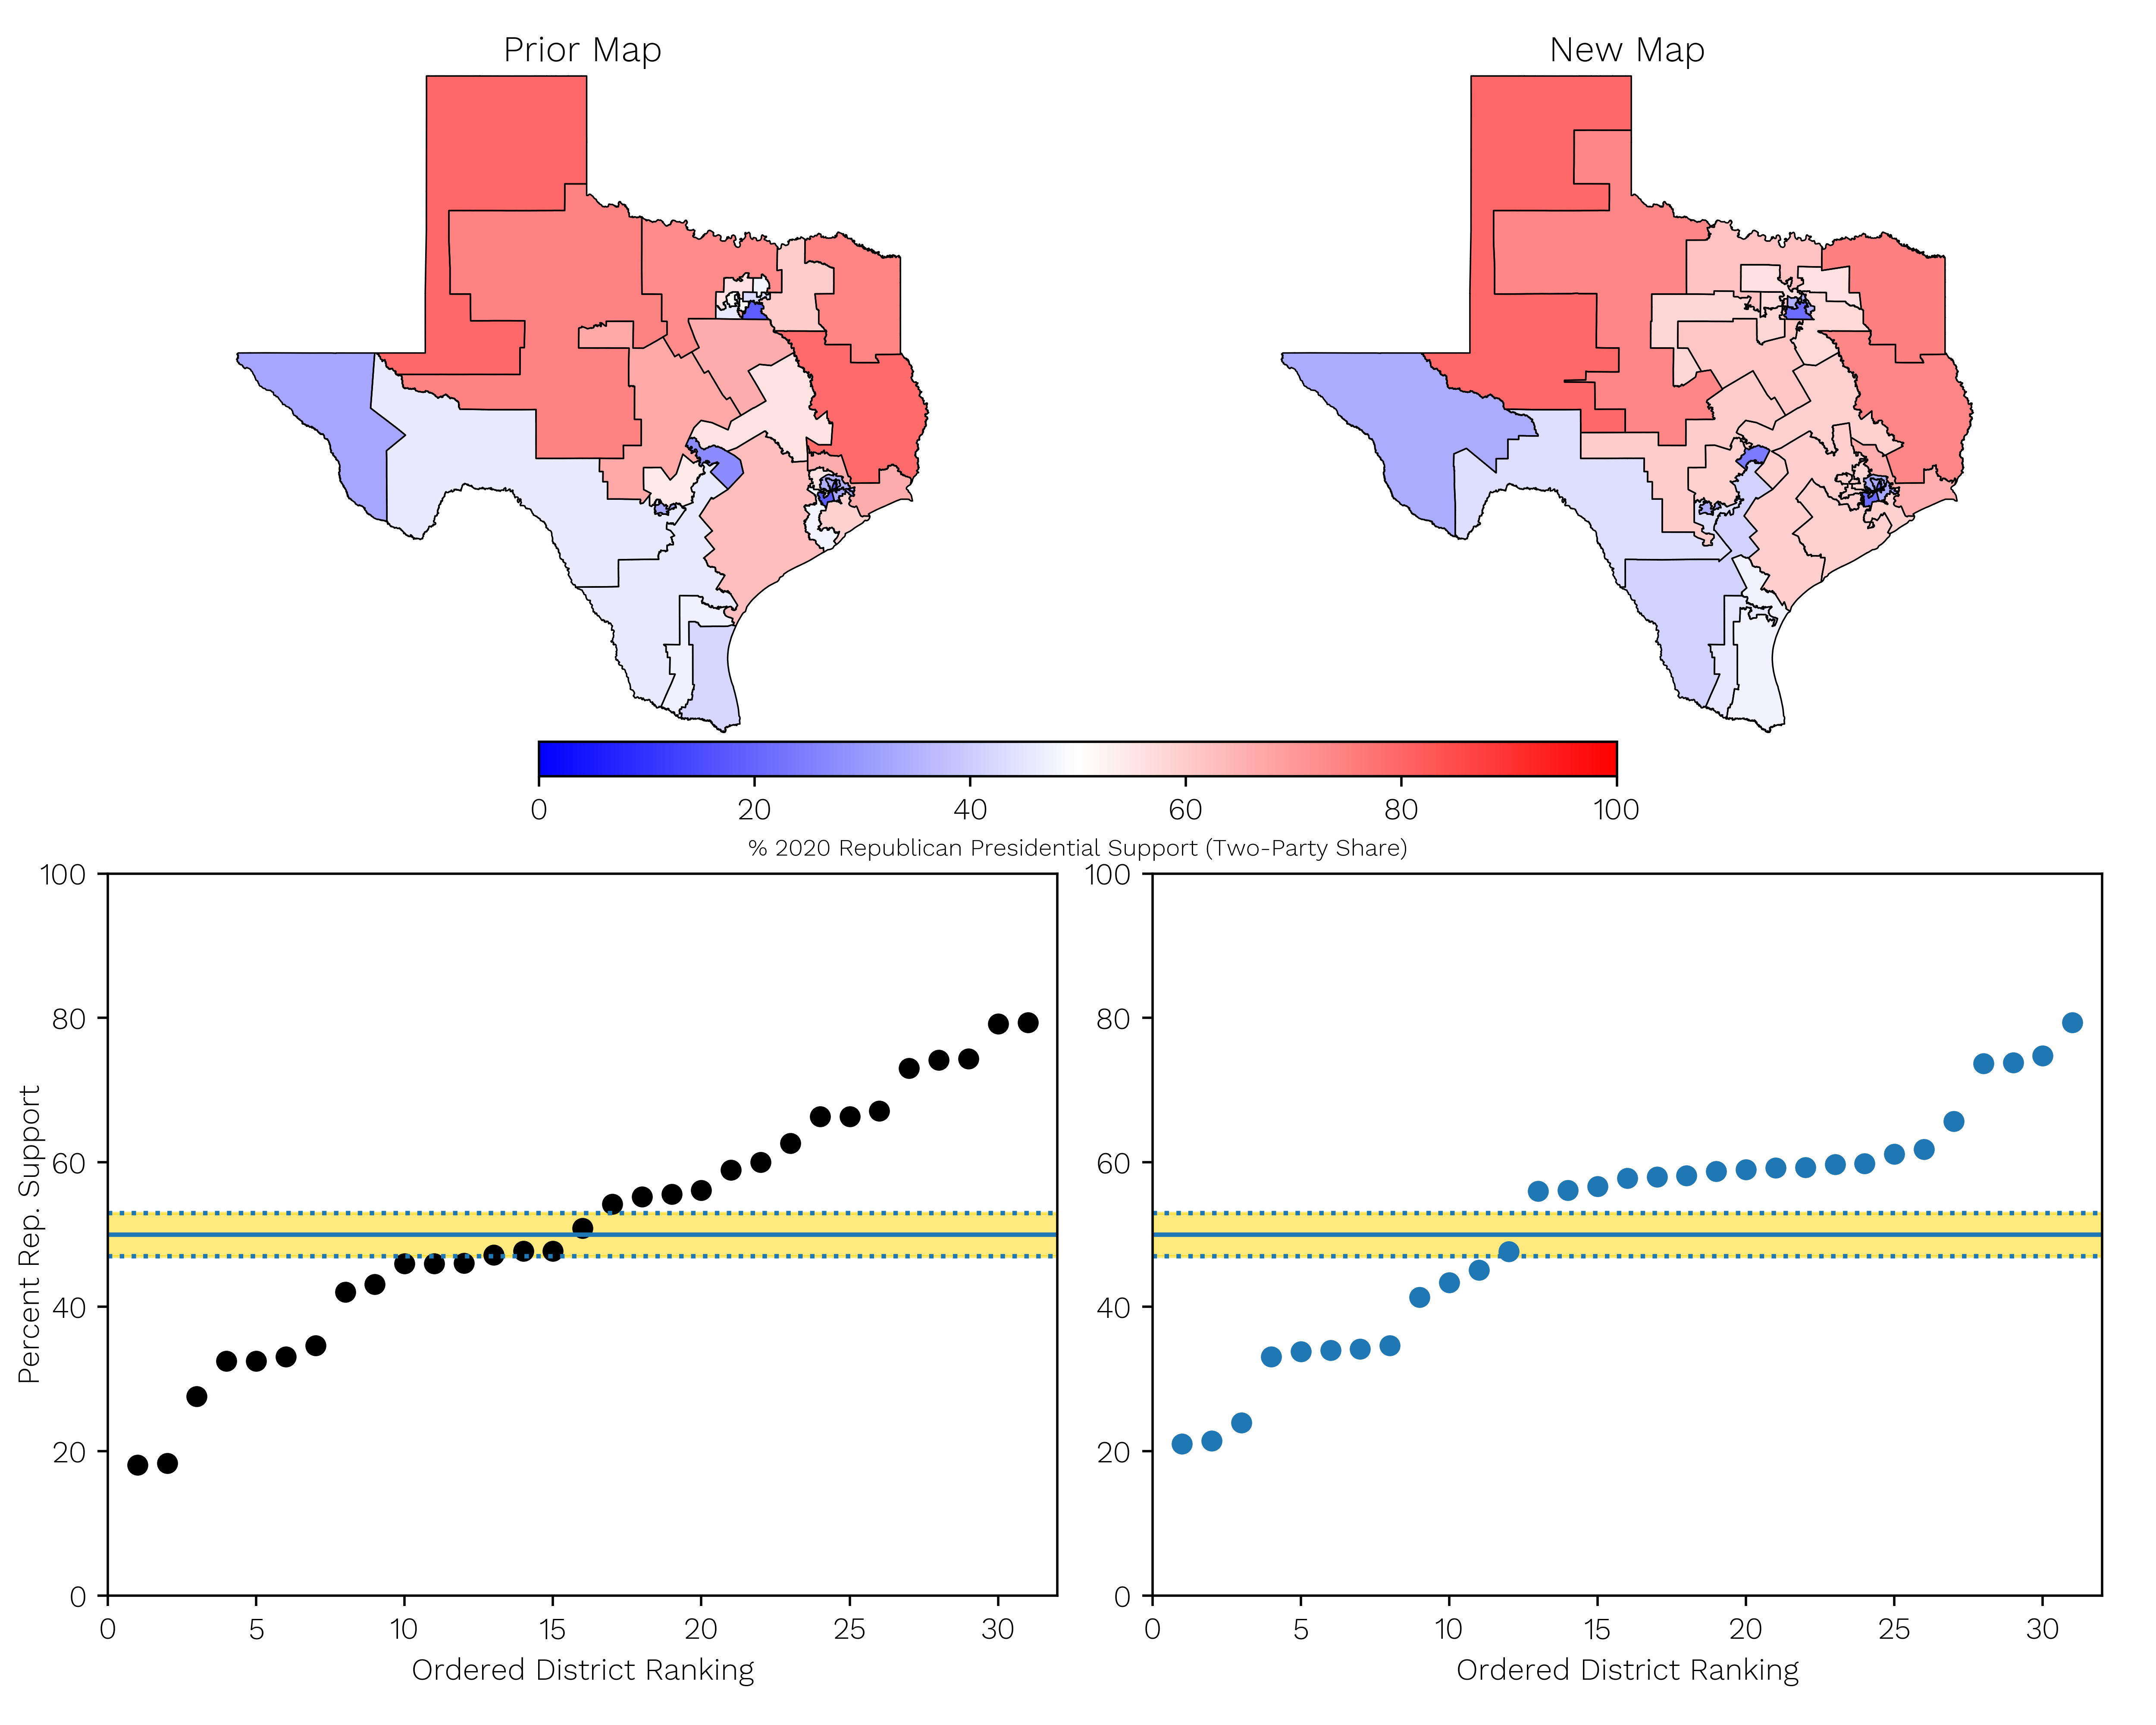
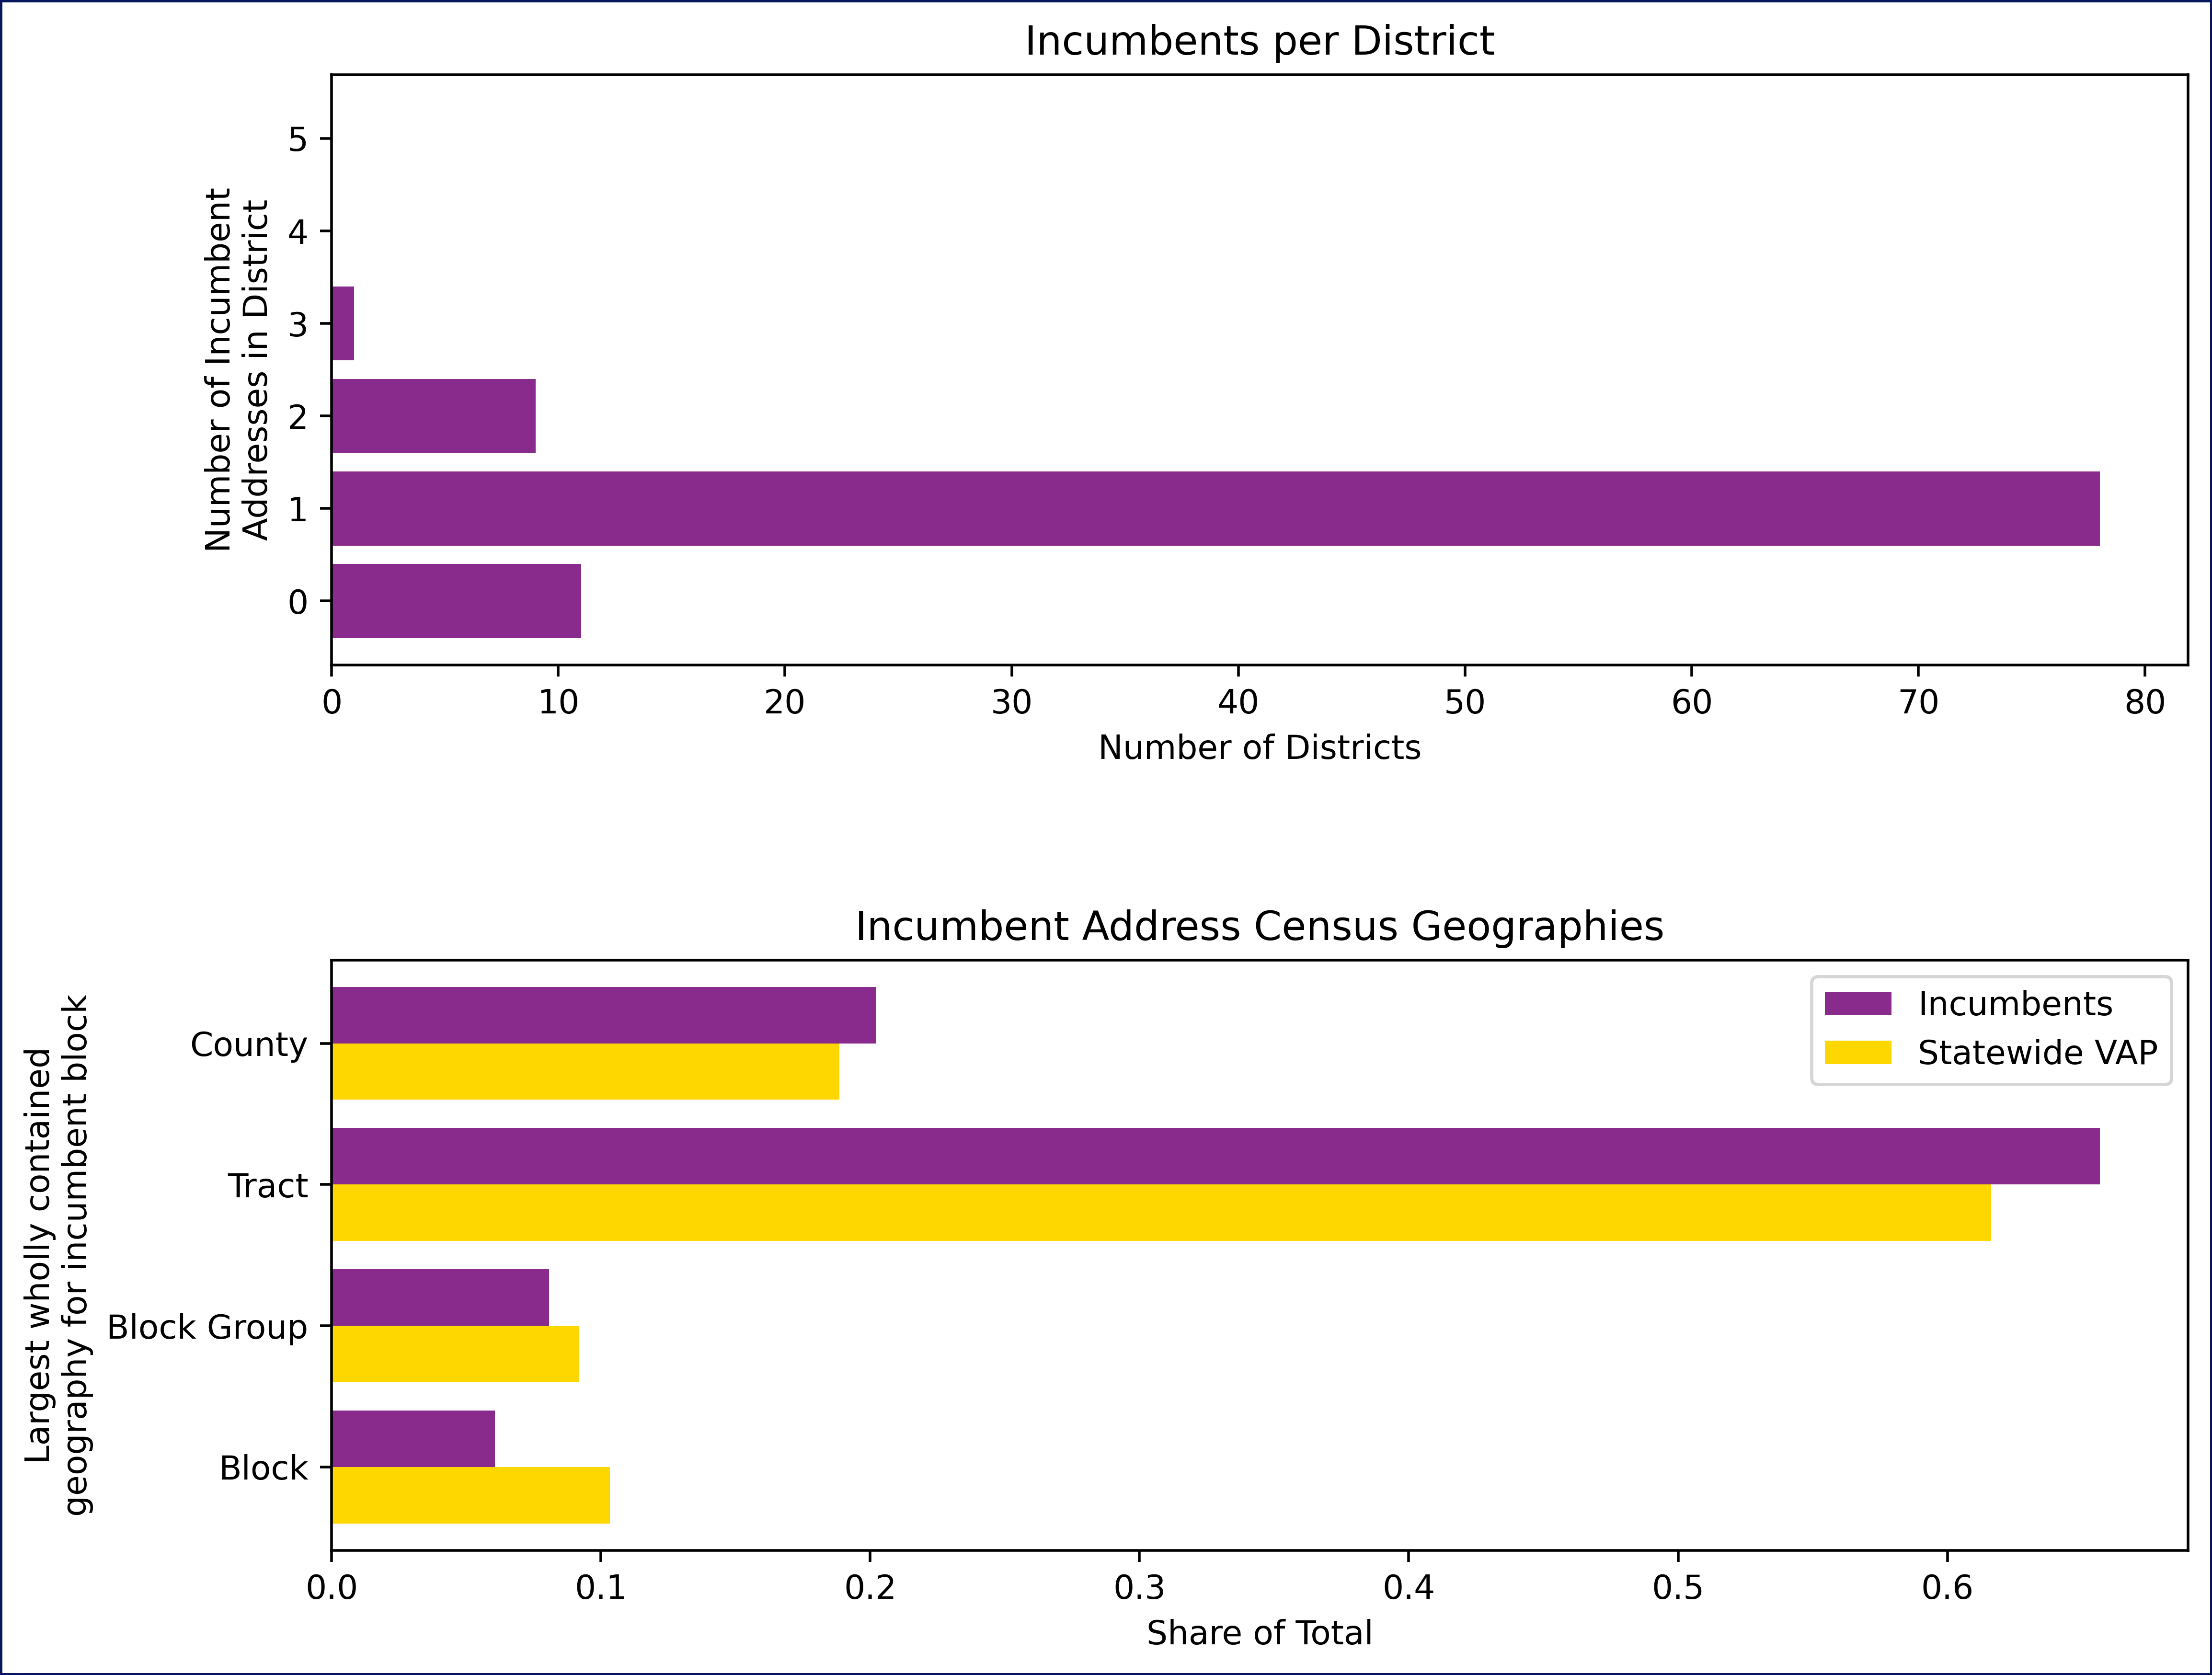
With each redistricting cycle comes a number of changes regarding the demographic, partisan, and political composition of state legislative and congressional districts. Our reports analyze the impact of redistricting in 19 states, revealing changes in the number of competitive and majority minority districts, as well as insights into voter turnout and incumbency.
State Reports on Data Accessibility in the 2021 Redistricting Cycle
Reports on the accessibility, usability, and overall quality of redistricting data in 14 states.
States vary widely in terms of what data they make publicly available and how accessible and easy it is to use. We evaluated 14 states with respect to how accessible and transparent they make key datasets for redistricting. Download our state reports to find out what states are doing well, and what they can improve on.
States that Adjust the Census Data for Redistricting
Track which states are using the PL 94-171 census data with or without adjustment for the purposes of legislative or congressional redistricting.
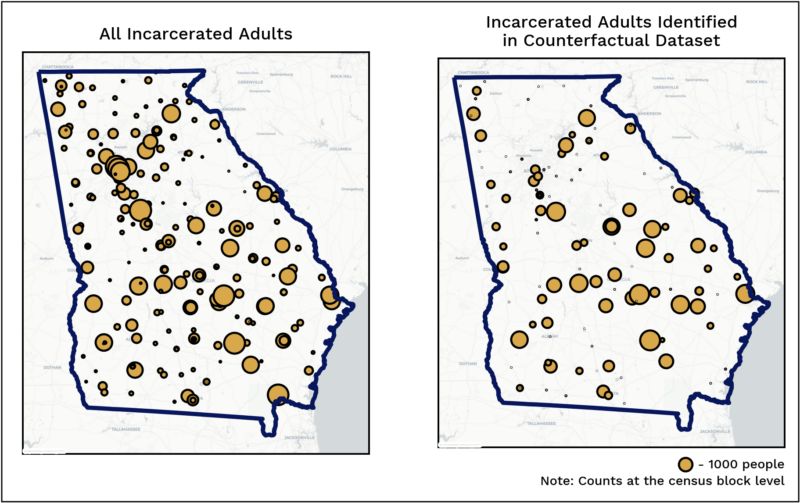
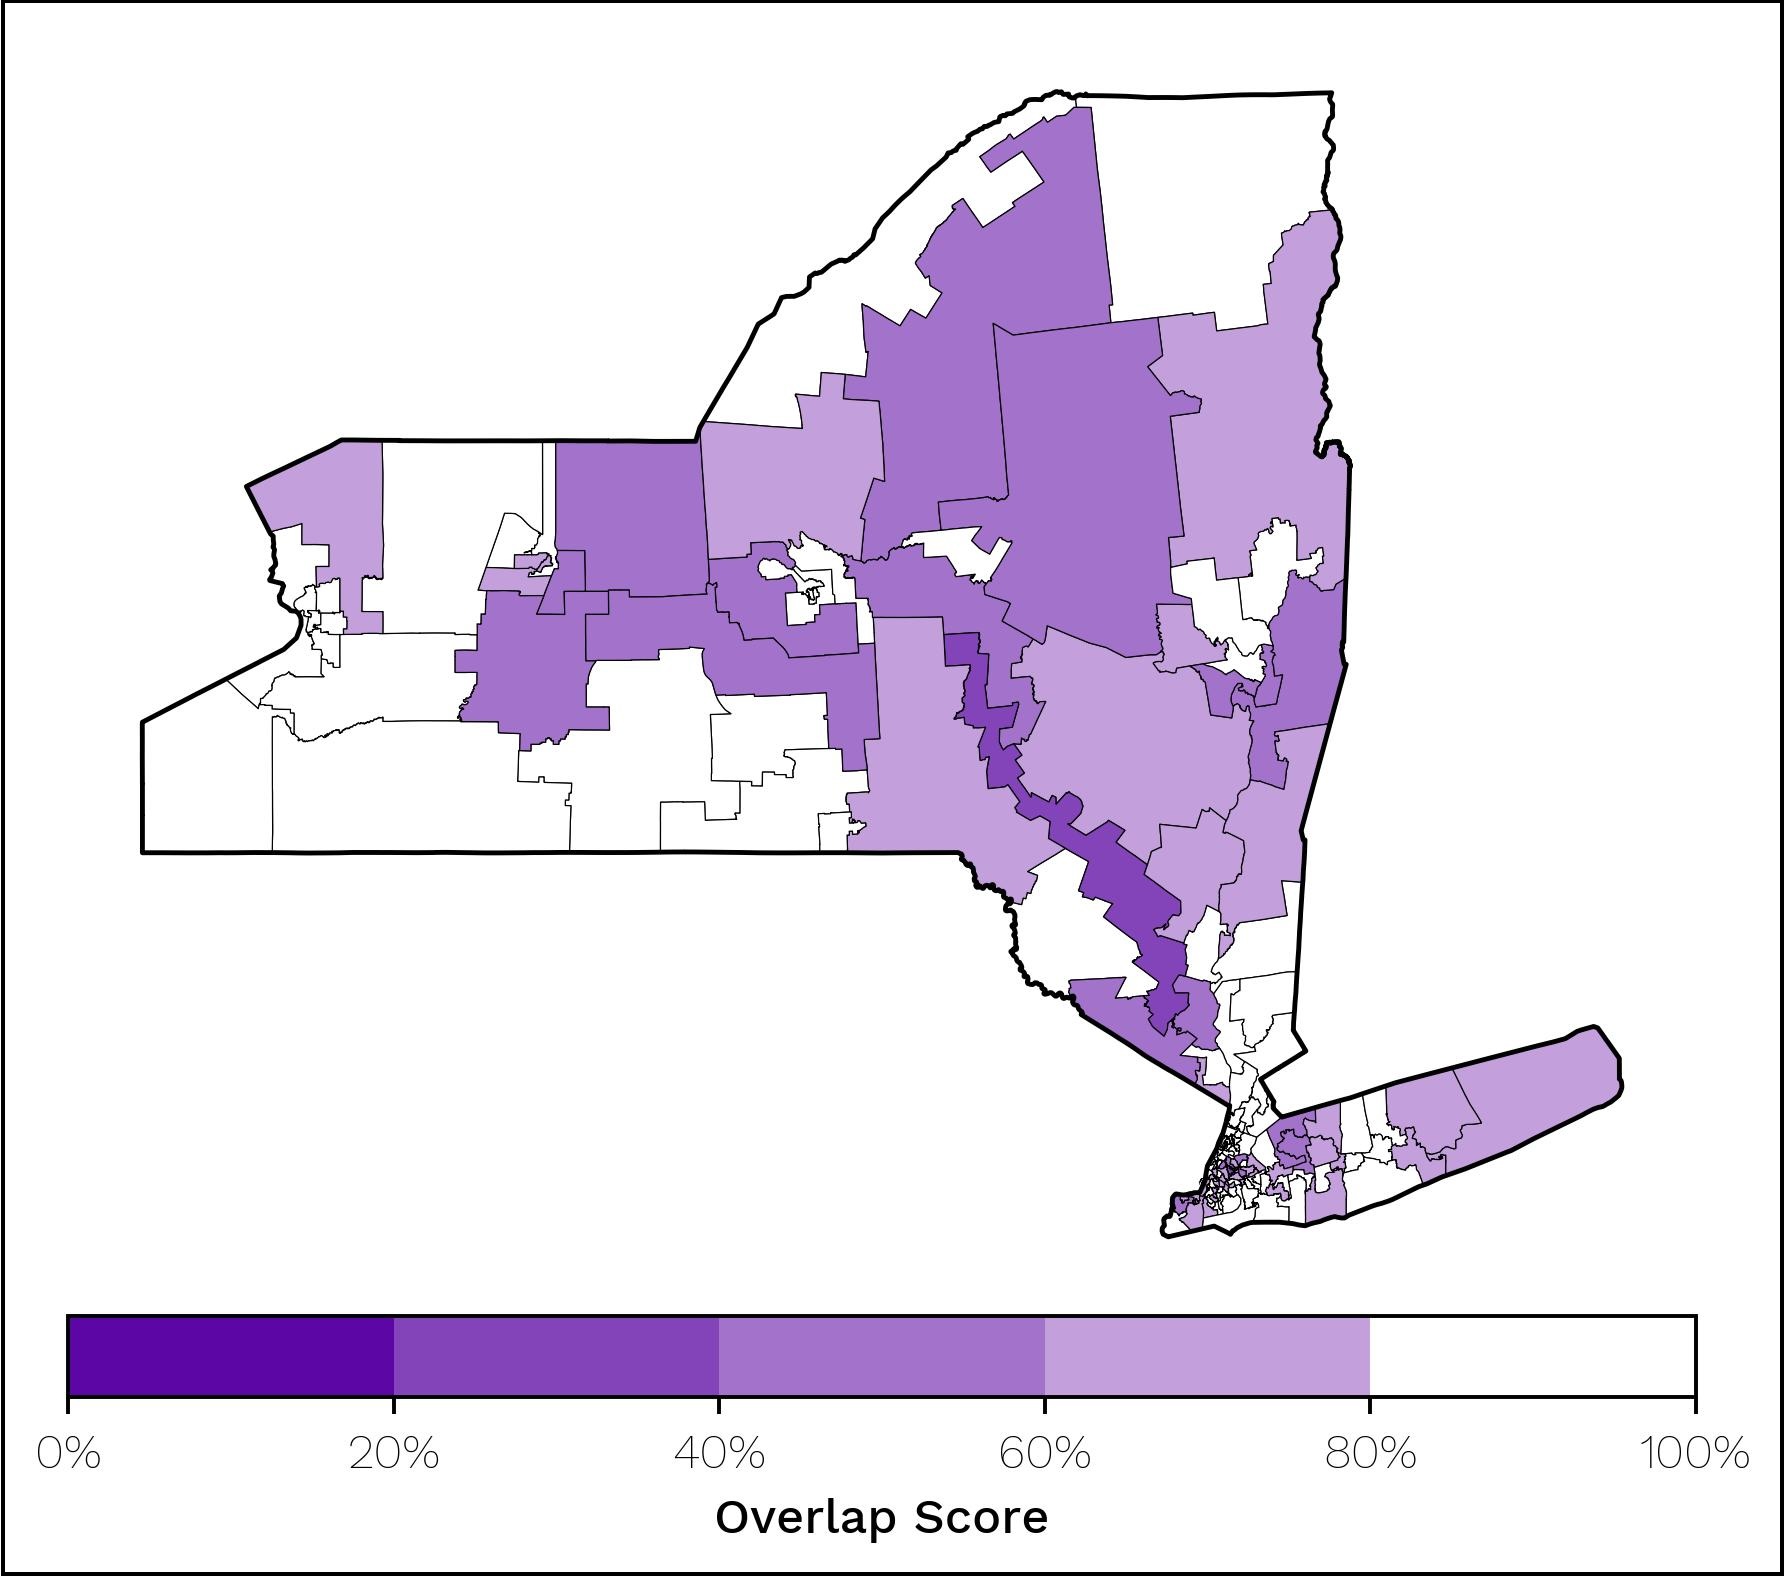
Read reports that demonstrate the differences between the unadjusted and adjusted data in applicable states. These reports show how adjustments change the population within a state and the implications for these changes on representation. For states that adjust their incarcerated population, the reports also incorporate facility location data from The Prison Policy Initiative.
Partner Data Validation
The Partner Data Validation project was an effort by our Data Analysts to peer-review the files we rehost from our Data Partners, who took on the task of collecting and making Precinct Boundaries joined with Election Results publicly available for redistricting.
In order to ensure that the Precinct Boundaries and Election Results (PBER) files that the RDH hosts are accurate and reproducible, our Data Team started the Partner Data Validation (PDV) project. In past redistricting cycles, every organization working on redistricting has done this work in their own state, often duplicating one another’s work. By tackling the project across the U.S., the RDH saved these organizations time and effort.
Population Change Reports
Population changes from the 2020 Census
Haystaq DNA created reports, which they have shared with the Redistricting Data Hub, containing visualizations detailing the changes in total population and population by race and ethnicity for congressional, state senate, state house/assembly, and major cities. Redistricting & You provides an online, interactive map to view the population counts from the most recent census.
