Used for US congressional and state legislative redistricting
The expanded report provides a detailed breakdown of the PL 94-171 data as released by the Census Bureau, compared to the reallocated, or adjusted data, provided by the state’s official redistricting body.
Specifically, this report details the differences in total population by census block, block group, tract, county, and state before and after reallocation. In states where comparisons are possible, these population differences are broken down by race and ethnicity.
DownloadNevada uses adjusted (or modified) data for US congressional and state legislative redistricting
Even in states where where the total population is unchanged, the distribution of population within the state can be affected.
To give you a sense for how these population shifts affect Nevada’s redistricting, the average district sizes in Nevada are:
The dataset used to create this report is the official redistricting dataset.
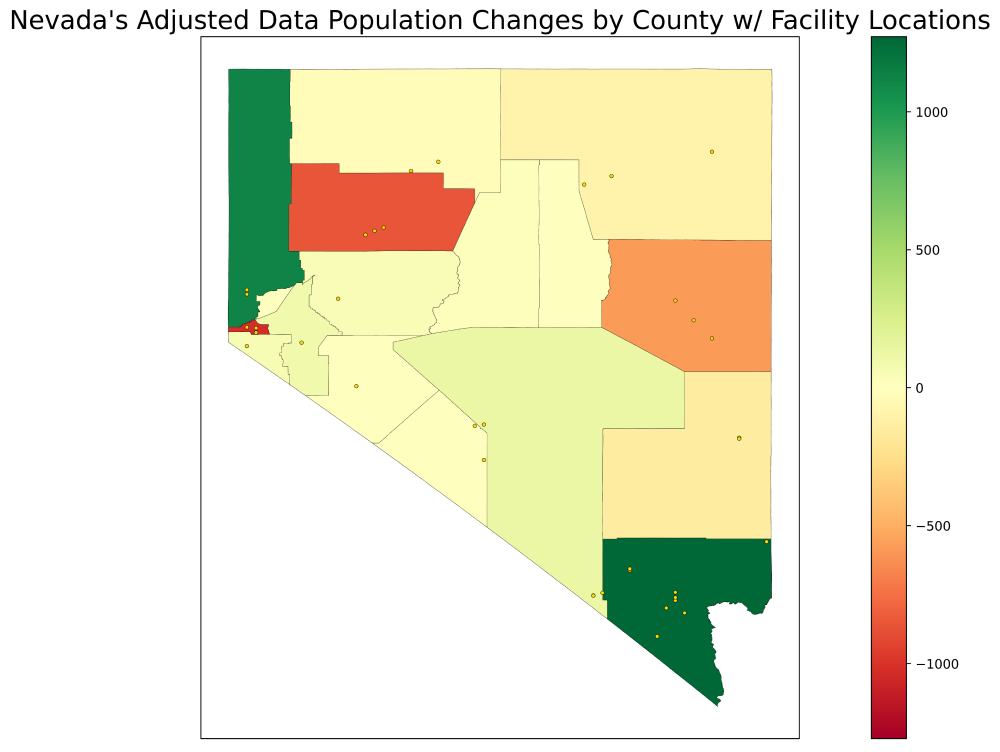
See the appendix for a detailed breakdown of county level population changes.
In general, the changes in block population are not uniform: most blocks are unaffected by modification, while a handful of blocks lose a large amount of population that goes to a larger number of blocks in smaller quantities.
| Population Change | Number of Blocks |
|---|---|
| Gained 100+ | 0 |
| Gained 51-100 | 3 |
| Gained 11-50 | 27 |
| Gained 6-10 | 112 |
| Gained 1-5 | 4,485 |
| No Change | 52,764 |
| Lost 1-5 | 0 |
| Lost 6-10 | 0 |
| Lost 11-50 | 0 |
| Lost 51-100 | 5 |
| Lost 100+ | 13 |
The official language for Nevada’s adjustment is:
Upon the completion of the national decennial census conducted by the Bureau of the Census of the United States Department of Commerce, the State Demographer shall revise the population counts for every block, block group and census tract as set forth in the census to count every inmate who was a resident of the State before incarceration in the block, block group and census tract of which an inmate was a resident before his or her incarceration… The population counts for every block, block group and census tract as revised by the State Demographer pursuant to NRS 360.288 must be used for the apportionment of legislative districts…. The population counts for every block, block group and census tract as revised by the State Demographer pursuant to NRS 360.288 must be used for the apportionment of congressional districts. [S]
Eight categories of race data were used, the total of these racial groups adds up to 100 percent.
| County | Adjusted Population Diff. | 1 White | 2 Black | 3 Asian | 4 American Indian | 5 Pacific Islander | 6 Some Other Race | 7 Other multiple-race | 8 Hispanic |
|---|---|---|---|---|---|---|---|---|---|
| Clark | 1,272 | 39.4% | 13.2% | 11.7% | 1.1% | 1.0% | 1.1% | 1.5% | 31.0% |
| Washoe | 1,113 | 59.2% | 3.1% | 7.2% | 2.5% | 0.8% | 1.4% | 0.7% | 25.1% |
| Nye | 129 | 72.3% | 3.6% | 2.7% | 3.1% | 0.7% | 1.6% | 0.6% | 15.4% |
| Lyon | 95 | 71.5% | 1.5% | 2.4% | 4.5% | 0.5% | 1.7% | 0.5% | 17.5% |
| Douglas | 54 | 78.5% | 0.7% | 2.7% | 3.4% | 0.3% | 1.6% | 0.4% | 12.4% |
| Churchill | 49 | 70.0% | 2.5% | 3.8% | 6.7% | 0.4% | 1.8% | 0.7% | 14.1% |
| Lander | 11 | 69.3% | 0.2% | 0.7% | 5.3% | 0.3% | 1.4% | 0.8% | 21.9% |
| Mineral | 8 | 62.8% | 4.3% | 2.2% | 17.5% | 0.2% | 0.9% | 0.9% | 11.2% |
| Storey | 5 | 81.3% | 0.7% | 2.8% | 3.7% | 0.3% | 2.1% | 0.8% | 8.3% |
| Eureka | 3 | 83.3% | 0.2% | 0.5% | 3.1% | 0.2% | 2.2% | 0.9% | 9.6% |
| Esmeralda | 0 | 71.5% | 1.4% | 0.7% | 5.3% | 0.1% | 0.1% | 1.8% | 19.1% |
| Humboldt | -32 | 63.8% | 1.1% | 1.4% | 5.1% | 0.2% | 1.9% | 0.3% | 26.1% |
| Elko | -99 | 63.6% | 1.3% | 1.6% | 6.3% | 0.3% | 1.3% | 0.3% | 25.3% |
| Lincoln | -146 | 85.3% | 3.8% | 0.5% | 2.0% | 0.4% | 0.8% | 0.6% | 6.5% |
| White Pine | -581 | 70.0% | 5.1% | 1.4% | 5.8% | 0.2% | 1.0% | 0.4% | 16.0% |
| Pershing | -855 | 63.1% | 5.5% | 1.9% | 5.2% | 0.2% | 1.0% | 0.5% | 22.5% |
| Carson City | -1,026 | 63.2% | 2.4% | 3.2% | 3.6% | 0.3% | 1.4% | 0.5% | 25.4% |