District Change Analysis
When states adopt new maps, understanding the partisan, demographic, and geographic changes is critical for voters, advocates, and policymakers. Our team has conducted rapid, comprehensive analyses of newly enacted state legislative and congressional maps to provide transparency and easily accessible analysis of the new districts.
Our analysis includes:
- Maps showing which districts changed and how
- District-by-district partisan performance using recent statewide election data
- Demographic breakdowns by race, ethnicity, and voting-age population
These district change reports are designed to present the data in an easy-to-follow format, enabling users to quickly draw their own conclusions about the changes to the map.
Read on for more details about the report contents, or download the reports now.
Inside the Reports
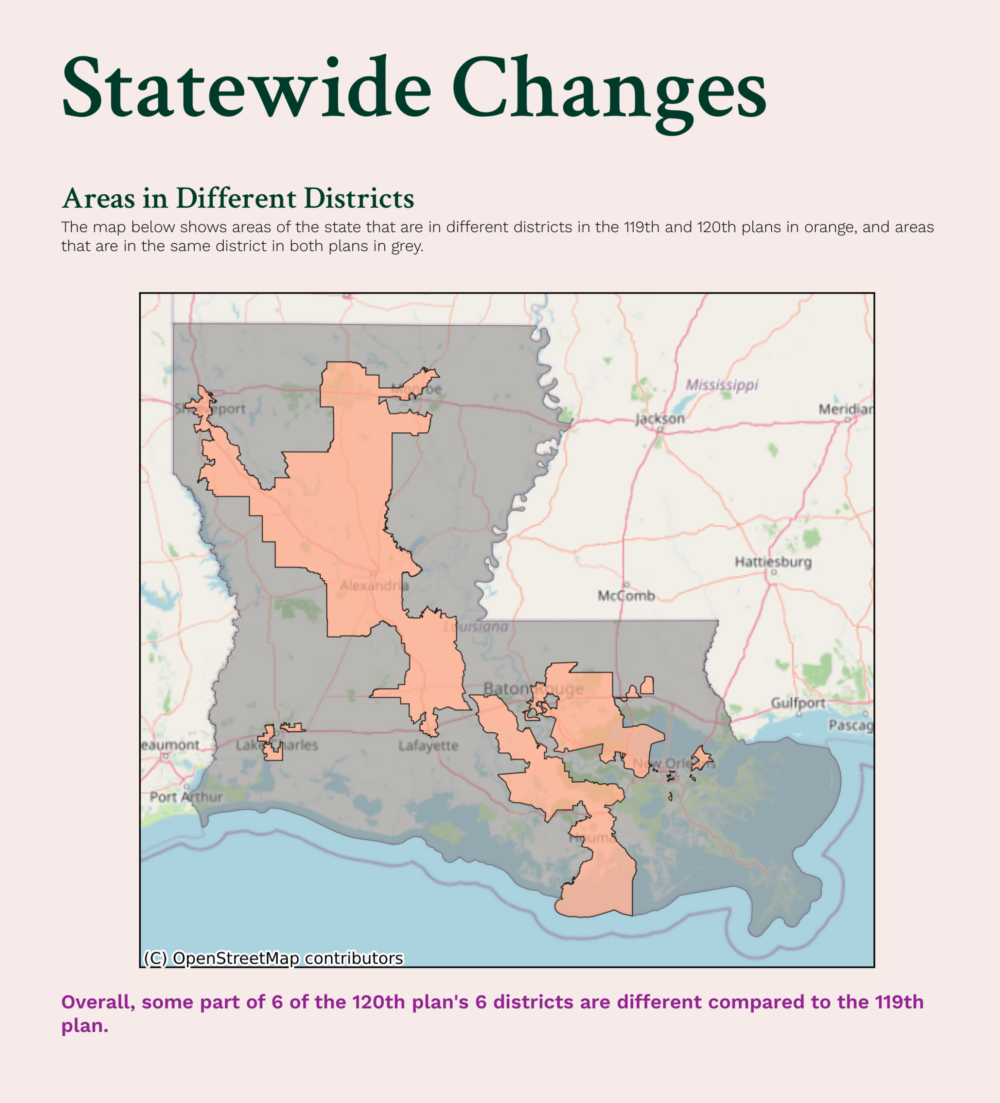
Statewide Impact
Each report begins with a statewide map that allows users to quickly see which areas were impacted by district changes. Unchanged areas are shaded grey, while redistricted regions are highlighted in orange.
A brief summary of the total number of districts in the state and how many of those districts were changed is included as well.
Demographics and Partisanship
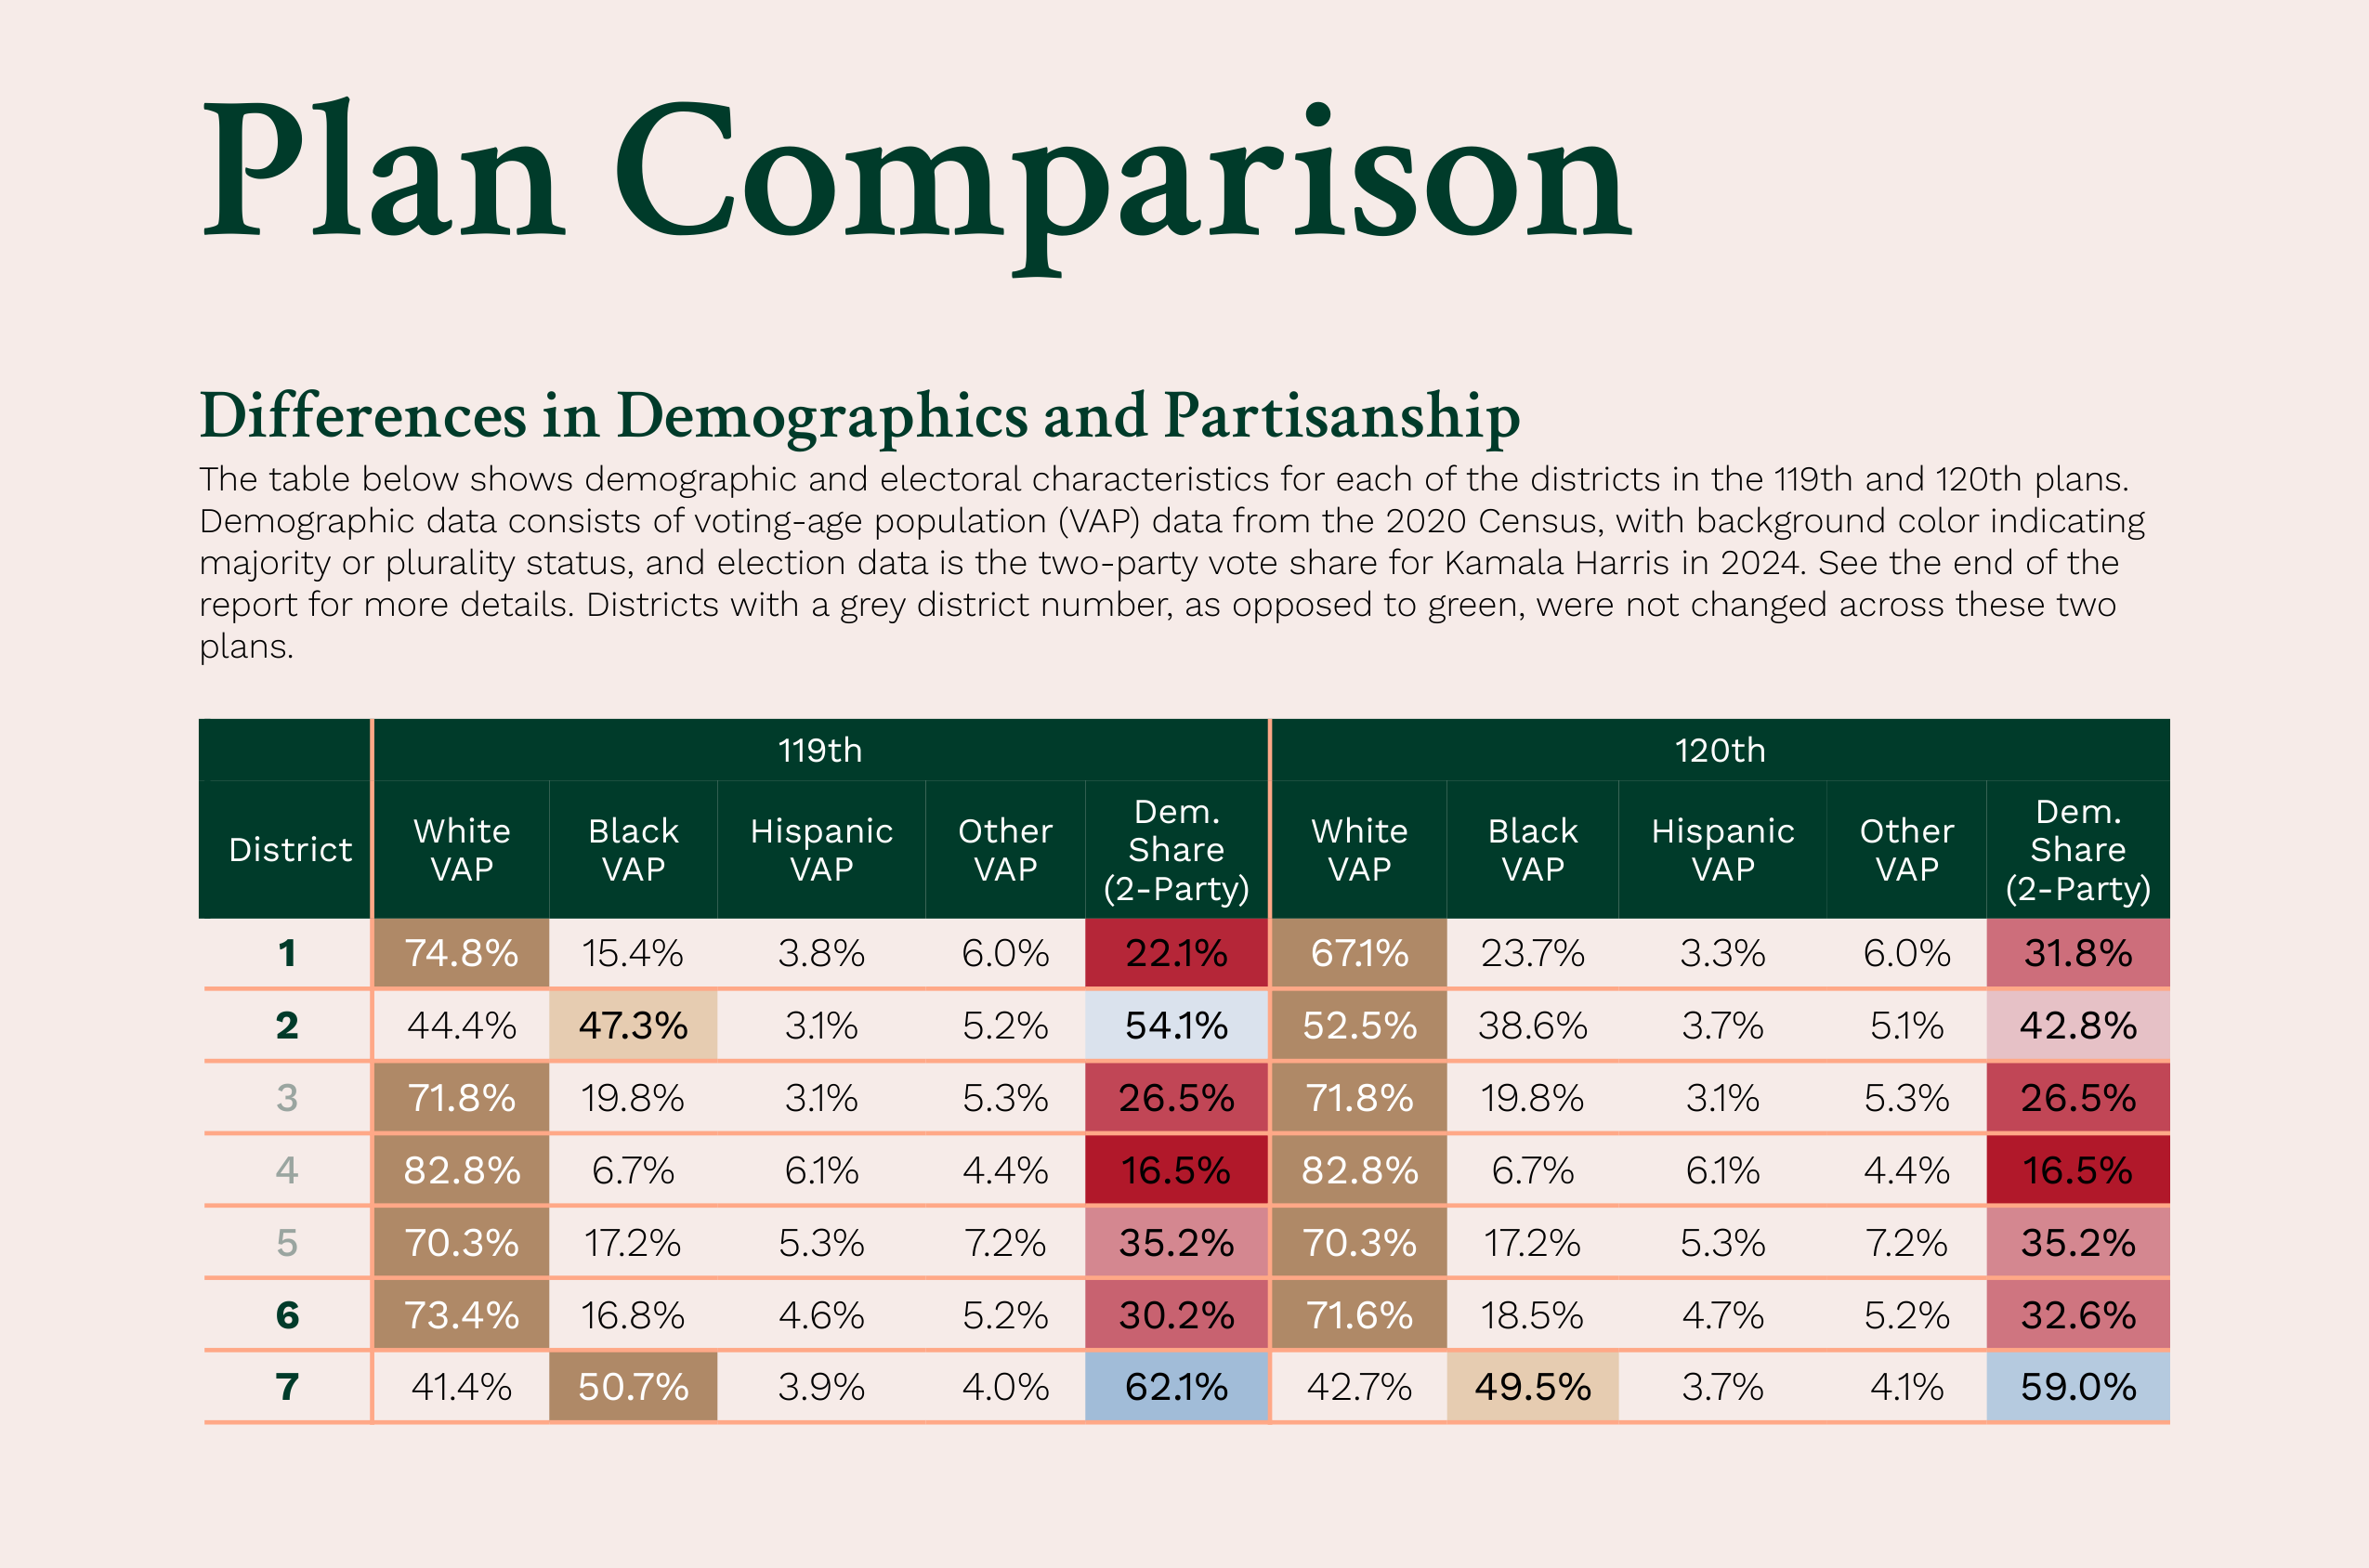
We then provide a side-by-side analysis comparing the demographics and partisanship of the two plans. The demographic breakdown of the district’s voting age population (VAP) – based on the 2020 decennial census – allows users to quickly see how the racial makeup of each district changes between the two plans.
The plan comparison data table is designed to present key metrics, making it easy to identify differences between the two plans.
- District numbers for unchanged districts are shaded light grey.
- Voting age population columns include shading to indicate majority or plurality status for each district.
- Election data is displayed as two-party vote share in the 2024 presidential election, with shading to indicate partisan lean.
County and Municipality Splits
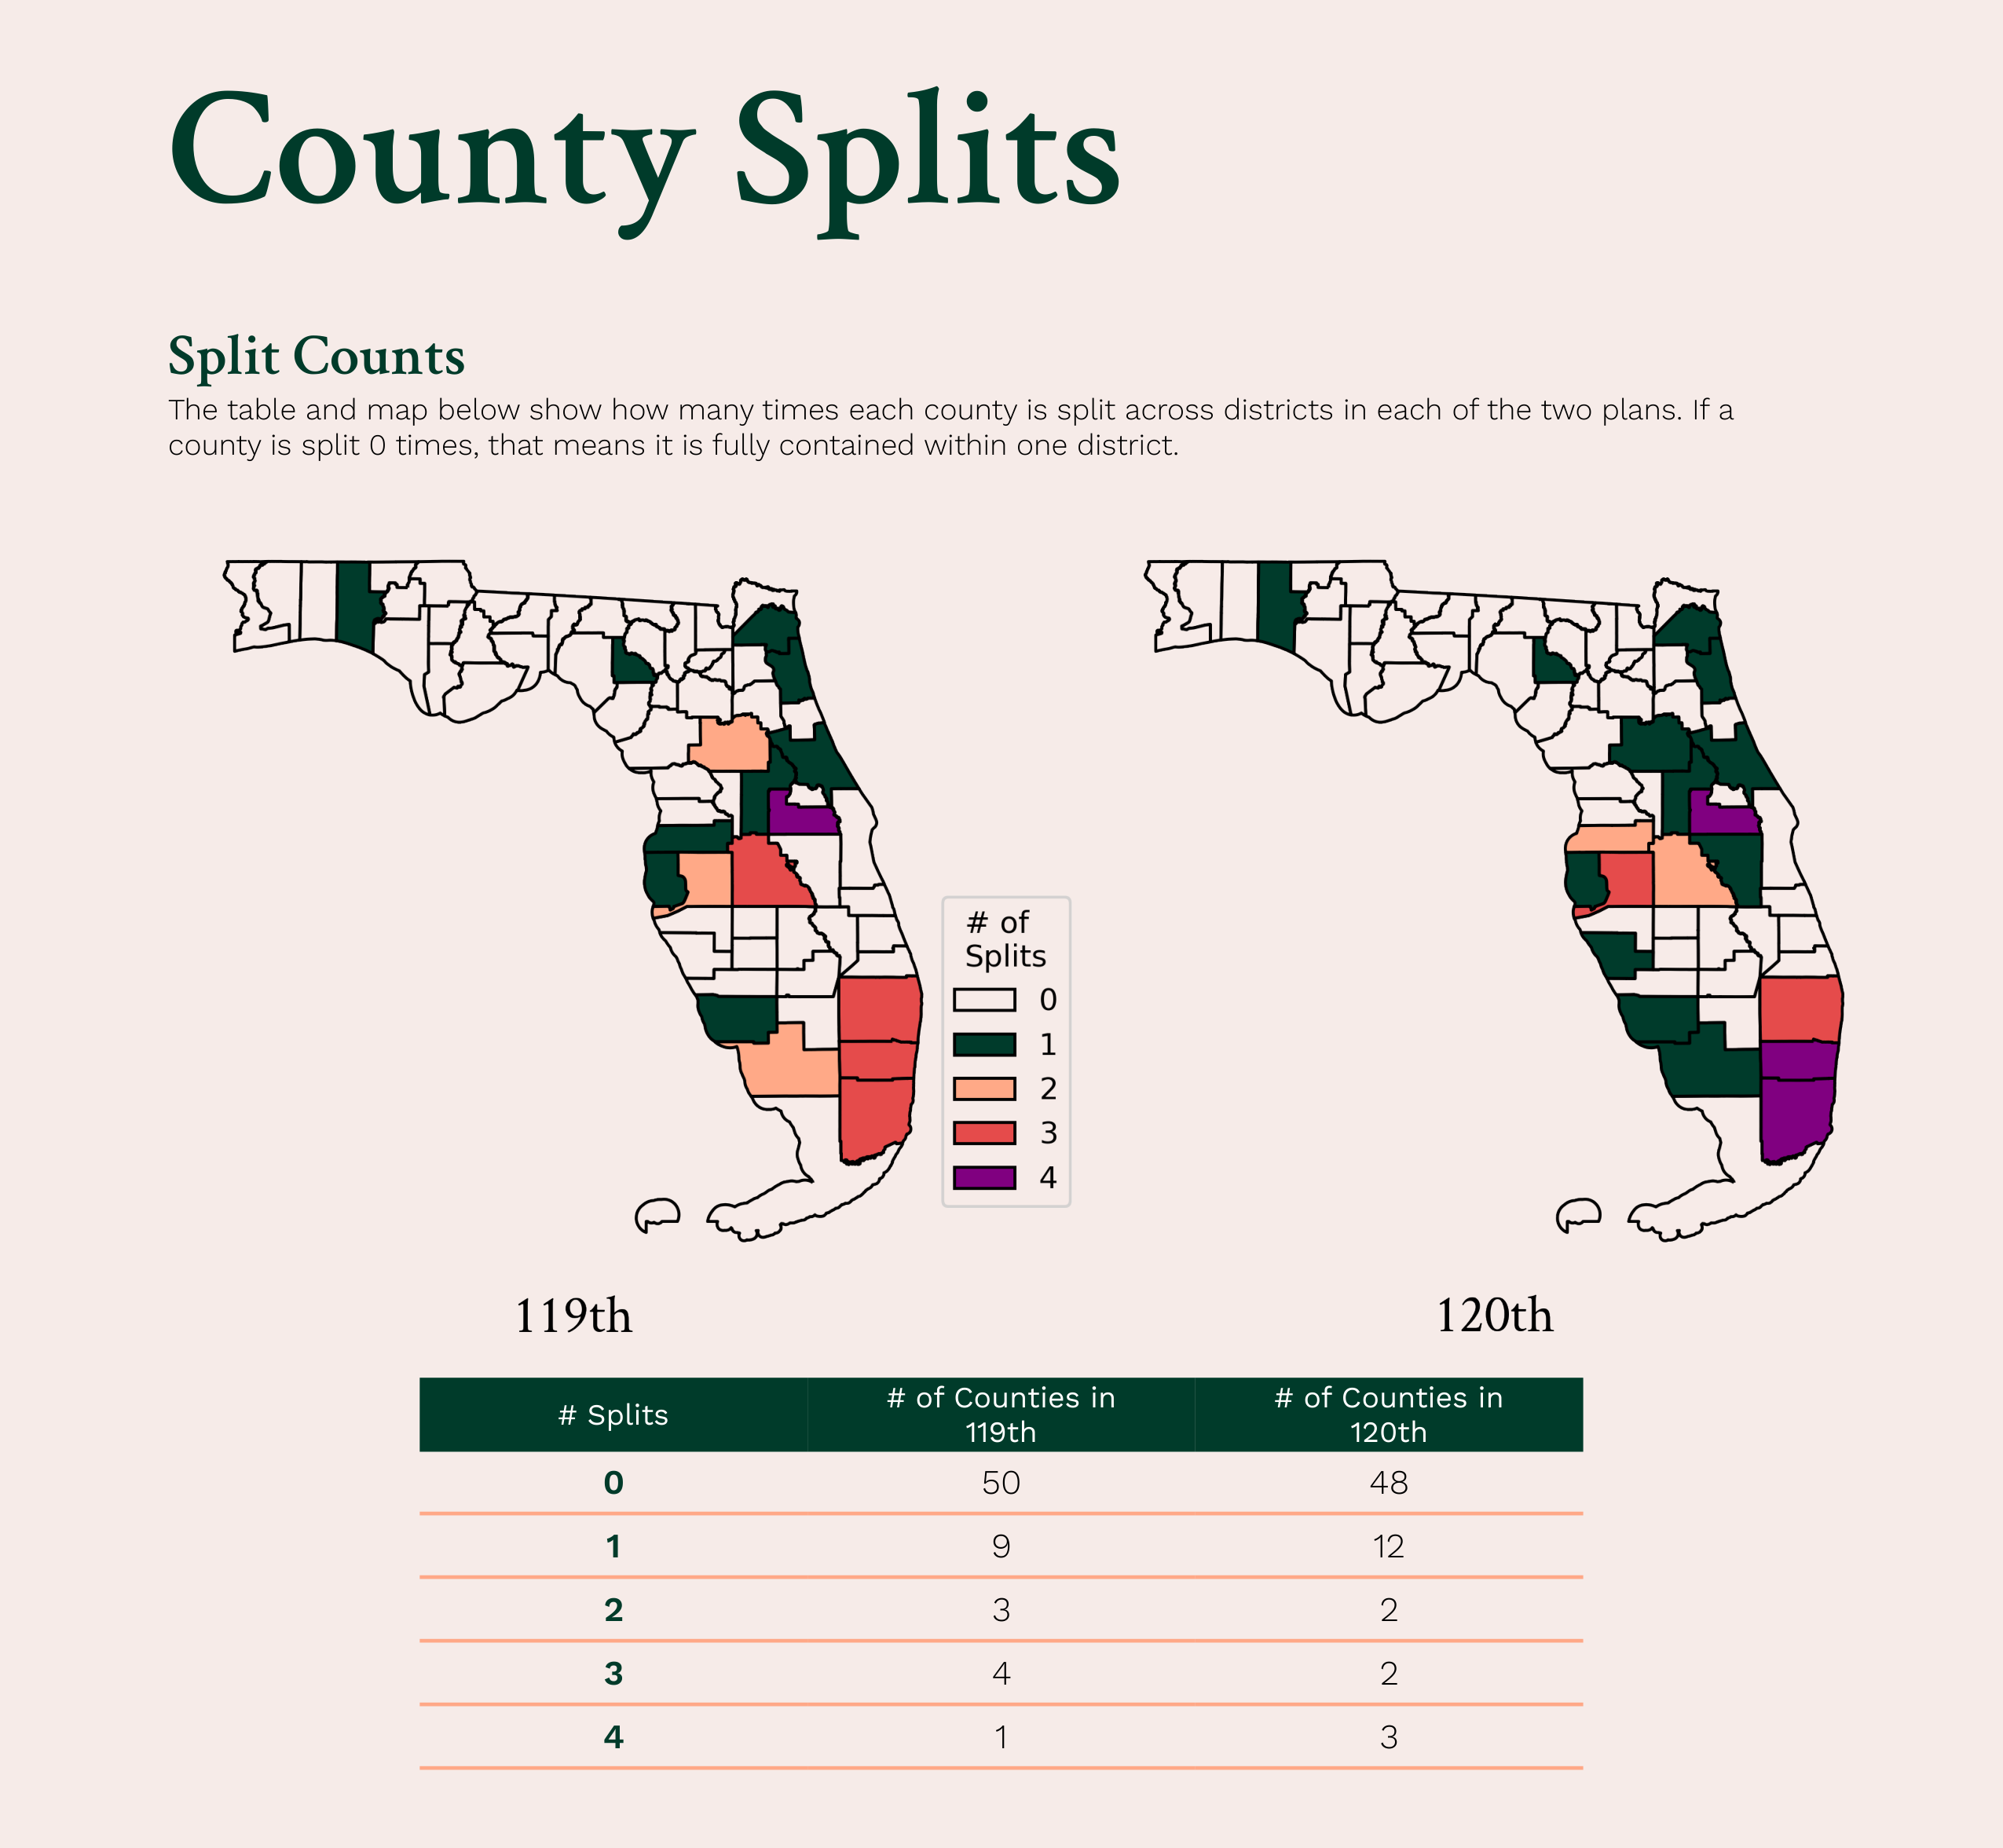
Data on both county and municipality splits is provided in tabular format, with a complementary color-coded visual for county splits. The municipality table displays the top 20 largest municipalities or census places based on 2020 total population.
The number of districts included in the specified area is 1 + the number of splits, so a county or municipality with 3 splits contains geographic areas in 4 separate districts.
Individual District Analysis
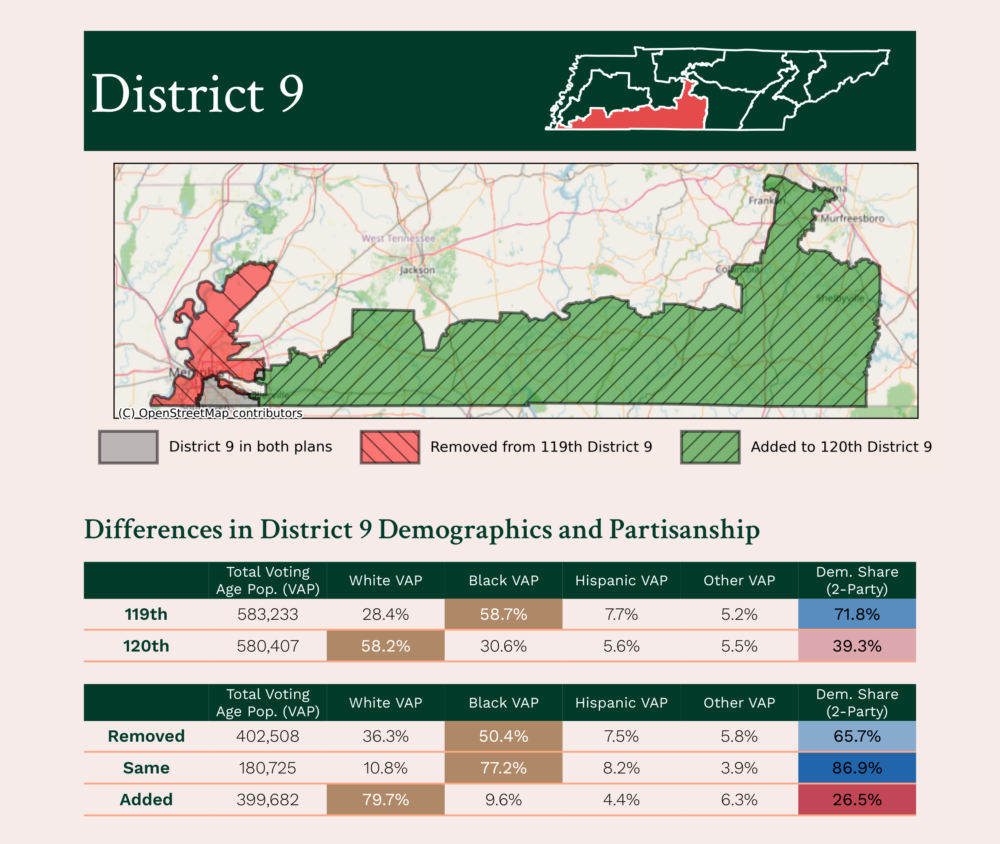
For each district that changed, the report includes a map with shaded areas to indicate which geographic area was included in the previous plan (grey), the area that has been added (green), and the area that has been removed (red).
Demographic and partisan data are included for each of those areas, as well as for the entire previous and new districts. The data tables include shading to indicate majority or plurality status and two-party vote share in the 2024 presidential election.
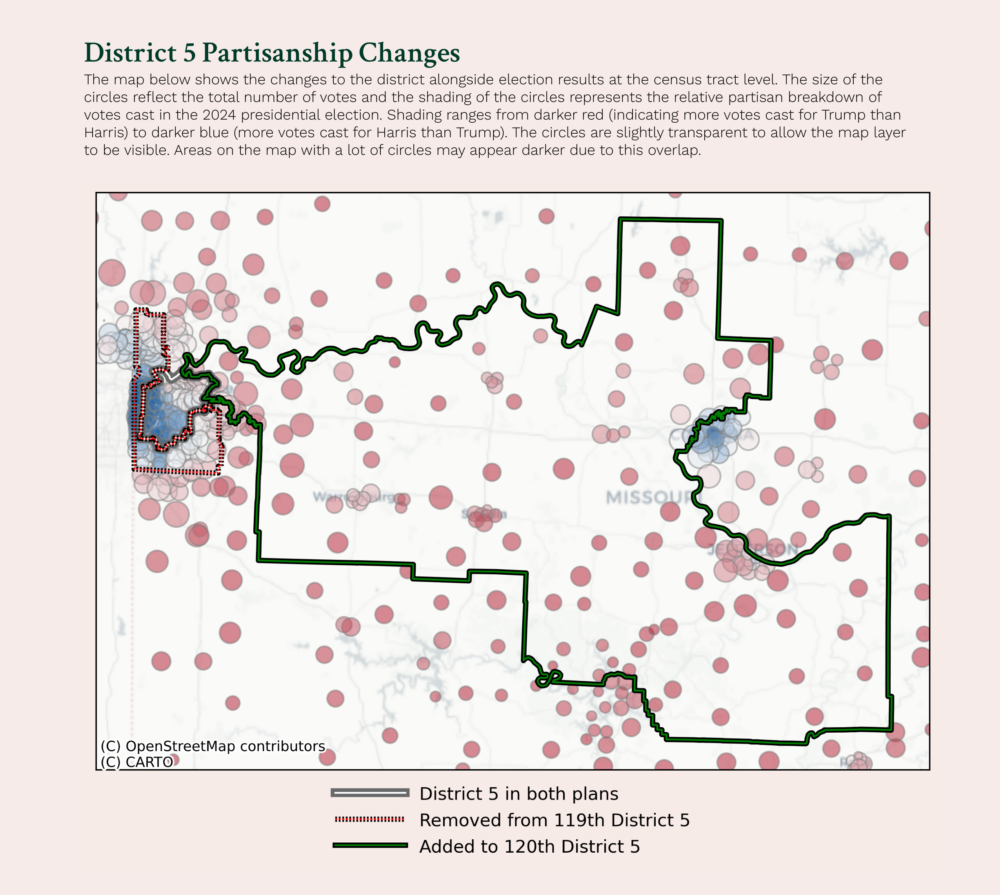
Differences in Partisanship
District partisanship is shown using overlays of 2024 presidential election results and the changed district boundaries. Each circle represents a census tract, with it’s size scaled to reflect the total number of votes in the tract. Circle shading is based on relative partisan breakdown of votes cast in the 2024 presidential election.